Estimated Value: $656,000 - $743,000
4
Beds
3
Baths
3,204
Sq Ft
$218/Sq Ft
Est. Value
About This Home
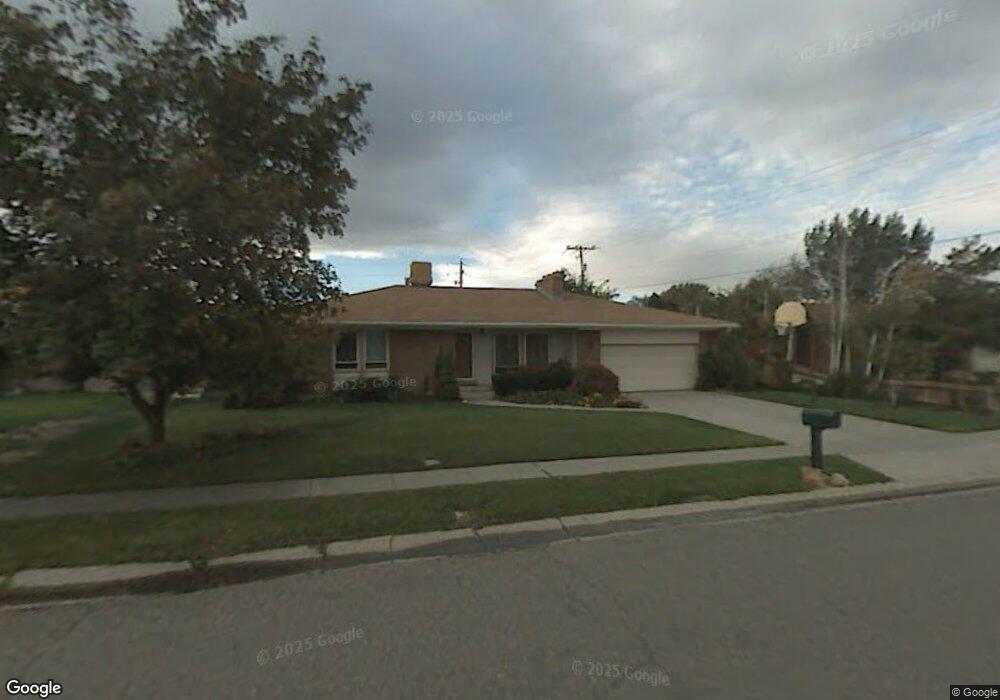
This home is located at 1628 E 8850 S, Sandy, UT 84093 and is currently estimated at $699,068, approximately $218 per square foot. 1628 E 8850 S is a home located in Salt Lake County with nearby schools including Silver Mesa Elementary School, Hillcrest High School, and Union Middle School.
Ownership History
Date
Name
Owned For
Owner Type
Purchase Details
Closed on
Aug 23, 2023
Sold by
W Scott Thomas Family Living Trust
Bought by
Burk Deborah K
Current Estimated Value
Purchase Details
Closed on
Apr 10, 2023
Sold by
1994 Thomas Family Trust
Bought by
W Scott Thomas Family Living Trust
Purchase Details
Closed on
Mar 9, 1994
Sold by
Thomas W Scott and Thomas Sherrie
Bought by
Thomas W Scott and Thomas Sherrie
Create a Home Valuation Report for This Property
The Home Valuation Report is an in-depth analysis detailing your home's value as well as a comparison with similar homes in the area
Home Values in the Area
Average Home Value in this Area
Purchase History
| Date | Buyer | Sale Price | Title Company |
|---|---|---|---|
| Burk Deborah K | -- | Real Advantage Title Insurance | |
| W Scott Thomas Family Living Trust | -- | None Listed On Document | |
| Thomas W Scott | -- | -- |
Source: Public Records
Tax History
| Year | Tax Paid | Tax Assessment Tax Assessment Total Assessment is a certain percentage of the fair market value that is determined by local assessors to be the total taxable value of land and additions on the property. | Land | Improvement |
|---|---|---|---|---|
| 2025 | $3,912 | $628,400 | $166,500 | $461,900 |
| 2024 | $3,912 | $594,400 | $155,600 | $438,800 |
| 2023 | $3,622 | $538,800 | $147,900 | $390,900 |
| 2022 | $3,724 | $551,600 | $145,000 | $406,600 |
| 2021 | $4,246 | $418,500 | $117,700 | $300,800 |
| 2020 | $3,111 | $378,300 | $117,700 | $260,600 |
| 2019 | $2,909 | $351,600 | $111,000 | $240,600 |
| 2016 | $2,640 | $312,200 | $111,000 | $201,200 |
Source: Public Records
Map
Nearby Homes
- 8857 S Capella Way
- 1430 E 8685 S
- 8921 S Shady Meadow Dr
- 1482 Waters Ln
- 8523 S 1430 E
- 8501 S 1475 E
- 8546 S 1330 E
- 1448 E Estrellita Dr
- 1924 E Viscounti Cove
- 1780 Julho St
- 8360 El Manicero Way
- 1492 E Sandy Hills Dr
- 1242 Earl Way
- 8620 S 1185 E
- 8935 Quarry Stone Way
- 1627 E Mulberry Way
- 1138 E Quarry Stone Way
- 8569 Round Stone Cove
- 8569 Round Stone Cove Unit 8
- 8483 S Terrace Dr
Your Personal Tour Guide
Ask me questions while you tour the home.