Estimated Value: $153,574 - $216,000
--
Bed
2
Baths
1,172
Sq Ft
$163/Sq Ft
Est. Value
About This Home
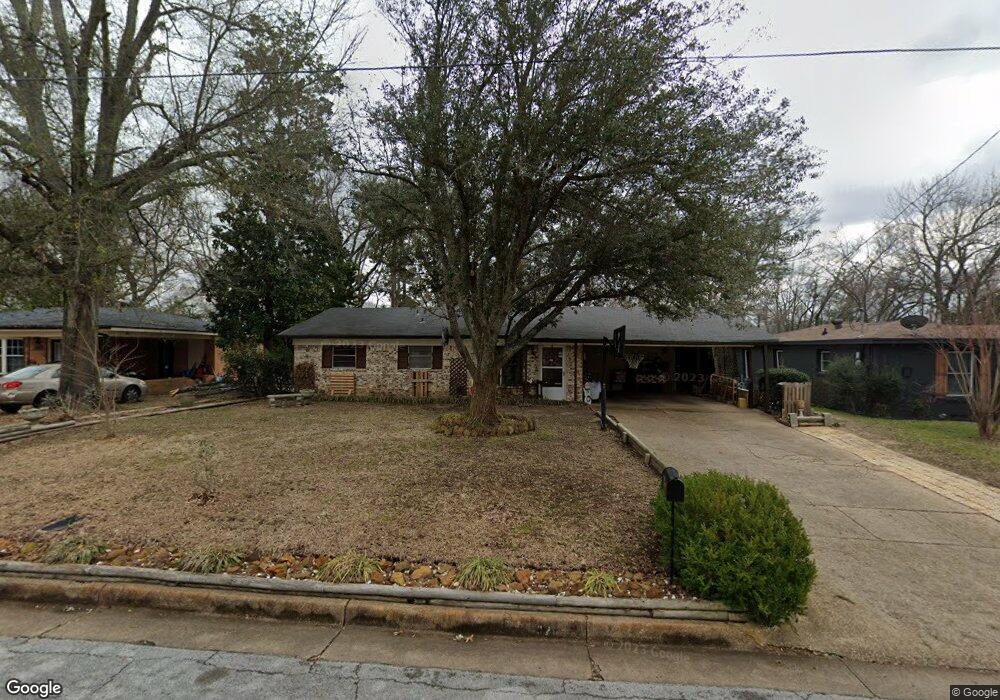
This home is located at 1628 Goliad St, Tyler, TX 75701 and is currently estimated at $190,894, approximately $162 per square foot. 1628 Goliad St is a home located in Smith County with nearby schools including Birdwell Dual Language Immersion School, Hogg Middle School, and Tyler Legacy High School.
Ownership History
Date
Name
Owned For
Owner Type
Purchase Details
Closed on
Feb 12, 2011
Sold by
Pack Timothy
Bought by
Cannon Harland E
Current Estimated Value
Purchase Details
Closed on
Feb 1, 2011
Sold by
Burleson Rachel Renee
Bought by
Cannon Harland E
Purchase Details
Closed on
Jan 22, 2011
Sold by
Harper Brenda Gale
Bought by
Cannon Harland E
Purchase Details
Closed on
Jan 20, 2011
Sold by
Lewis Ambrosia D
Bought by
Cannon Harland E
Purchase Details
Closed on
Jan 11, 2011
Sold by
Pack Bradley Ray
Bought by
Cannon Harland E
Purchase Details
Closed on
Dec 29, 2010
Sold by
Pack Billy Wayne
Bought by
Cannon Harland E
Purchase Details
Closed on
Dec 13, 2010
Sold by
Pack Ralph Edward
Bought by
Cannon Harland E
Purchase Details
Closed on
May 27, 2010
Sold by
Cannon Harland E
Bought by
Russeau Debra Jean
Create a Home Valuation Report for This Property
The Home Valuation Report is an in-depth analysis detailing your home's value as well as a comparison with similar homes in the area
Home Values in the Area
Average Home Value in this Area
Purchase History
| Date | Buyer | Sale Price | Title Company |
|---|---|---|---|
| Cannon Harland E | -- | None Available | |
| Cannon Harland E | -- | None Available | |
| Cannon Harland E | -- | None Available | |
| Cannon Harland E | -- | None Available | |
| Cannon Harland E | -- | None Available | |
| Cannon Harland E | -- | None Available | |
| Cannon Harland E | -- | None Available | |
| Russeau Debra Jean | -- | None Available |
Source: Public Records
Tax History Compared to Growth
Tax History
| Year | Tax Paid | Tax Assessment Tax Assessment Total Assessment is a certain percentage of the fair market value that is determined by local assessors to be the total taxable value of land and additions on the property. | Land | Improvement |
|---|---|---|---|---|
| 2025 | $741 | $135,964 | $30,960 | $105,004 |
| 2024 | $741 | $121,905 | $15,285 | $111,965 |
| 2023 | $1,932 | $116,537 | $15,285 | $101,252 |
| 2022 | $1,974 | $100,748 | $15,285 | $85,463 |
| 2021 | $1,815 | $86,524 | $15,285 | $71,239 |
| 2020 | $1,803 | $86,008 | $15,285 | $70,723 |
| 2019 | $1,675 | $77,940 | $13,247 | $64,693 |
| 2018 | $1,514 | $69,633 | $10,190 | $59,443 |
| 2017 | $1,487 | $69,633 | $10,190 | $59,443 |
| 2016 | $1,557 | $72,926 | $10,190 | $62,736 |
| 2015 | $396 | $70,185 | $10,190 | $59,995 |
| 2014 | $396 | $67,977 | $10,190 | $57,787 |
Source: Public Records
Map
Nearby Homes
- 1672 Alamo Crossing
- 3426 Bienville Dr
- 3413 Iberville Dr
- 3425 Iberville Dr
- 1506 Bowie Dr
- 2922 W Azalea Dr
- 1531 Woodland Hills Dr
- 3048 Concord Place
- 3505 Cloverdale Dr
- 3045 Concord Place
- 1209 Terre Haute Dr
- 2922 Frankston Hwy
- 1317 Woodland Hills Dr
- 3404 Silverwood Dr
- 3501 Silverwood Dr
- 3012 Frankston Hwy
- 3518 Cloverdale Dr
- 3016 Frankston Hwy
- 2319 Luther St
- 3500 Silverwood Dr
- 1708 Goliad St
- 1624 1624 Goliad
- 1624 Goliad St
- 1618 Goliad St
- 1712 Goliad St
- 1625 1625 Goliad
- 1629 Goliad St
- 1625 Goliad St
- 1614 Goliad St
- 1621 Goliad St
- 1615 Goliad St
- 1606 Goliad St
- 3145 3145 San Jancinto
- 3145 3145 San Jacinto
- 3120 San Jacinto Dr
- 3155 3155 San Jacinto Dr
- 3145 San Jacinto Dr Unit 2
- 1609 Goliad St
- 3165 San Jacinto Dr
- 3135 San Jacinto Dr