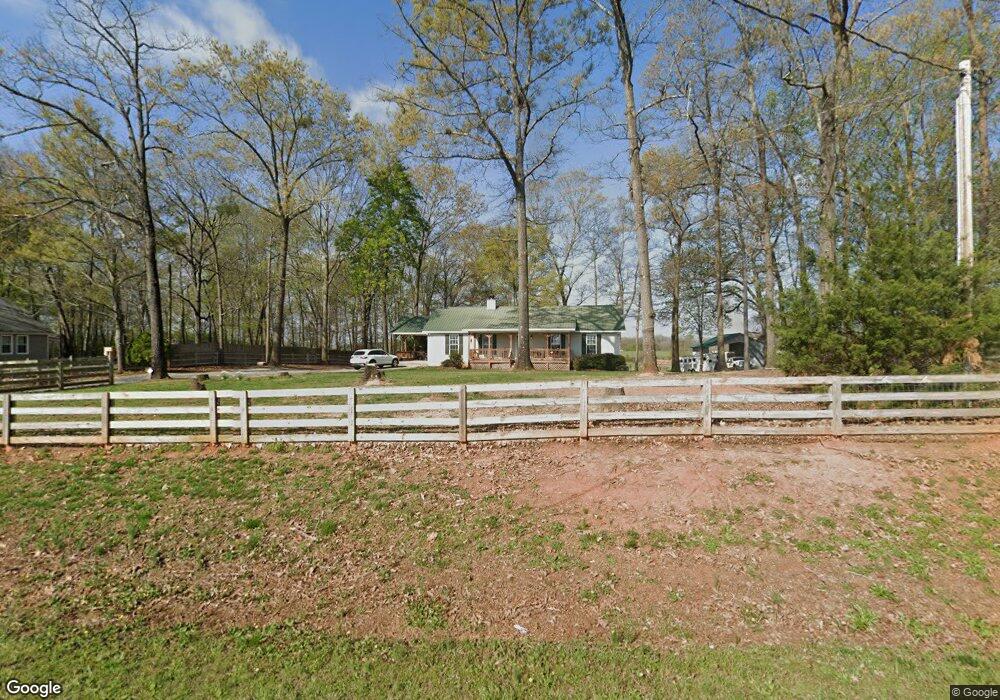
1628 Neese Commerce Rd Commerce, GA 30530
Estimated Value: $303,000 - $331,000
3
Beds
2
Baths
1,680
Sq Ft
$188/Sq Ft
Est. Value
About This Home
This home is located at 1628 Neese Commerce Rd, Commerce, GA 30530 and is currently estimated at $315,054, approximately $187 per square foot. 1628 Neese Commerce Rd is a home located in Madison County with nearby schools including Madison County High School.
Ownership History
Date
Name
Owned For
Owner Type
Purchase Details
Closed on
Mar 5, 2019
Sold by
Harrell Thomas
Bought by
Brannon Lindsay M
Current Estimated Value
Home Financials for this Owner
Home Financials are based on the most recent Mortgage that was taken out on this home.
Original Mortgage
$162,137
Outstanding Balance
$142,546
Interest Rate
4.4%
Mortgage Type
New Conventional
Estimated Equity
$172,508
Purchase Details
Closed on
Sep 4, 2012
Sold by
Hemphill Katie
Bought by
Harrell Thomas
Purchase Details
Closed on
Aug 22, 2005
Sold by
Willoughby Gerald Thomas
Bought by
Hemphill Katie
Purchase Details
Closed on
Jan 18, 2002
Sold by
Willoughby Cathy Ren
Bought by
Willoughby Gerald T
Purchase Details
Closed on
Jan 1, 1992
Sold by
Willoughby Gerald T
Bought by
Willoughby Gerald Thomas
Purchase Details
Closed on
Jan 1, 1989
Bought by
Willoughby Gerald T
Create a Home Valuation Report for This Property
The Home Valuation Report is an in-depth analysis detailing your home's value as well as a comparison with similar homes in the area
Home Values in the Area
Average Home Value in this Area
Purchase History
| Date | Buyer | Sale Price | Title Company |
|---|---|---|---|
| Brannon Lindsay M | $175,000 | -- | |
| Harrell Thomas | $36,021 | -- | |
| Hemphill Katie | $159,000 | -- | |
| Willoughby Gerald T | -- | -- | |
| Willoughby Gerald Thomas | -- | -- | |
| Willoughby Gerald T | $6,000 | -- |
Source: Public Records
Mortgage History
| Date | Status | Borrower | Loan Amount |
|---|---|---|---|
| Open | Brannon Lindsay M | $162,137 |
Source: Public Records
Tax History Compared to Growth
Tax History
| Year | Tax Paid | Tax Assessment Tax Assessment Total Assessment is a certain percentage of the fair market value that is determined by local assessors to be the total taxable value of land and additions on the property. | Land | Improvement |
|---|---|---|---|---|
| 2024 | $2,448 | $94,037 | $19,008 | $75,029 |
| 2023 | $2,617 | $85,725 | $15,840 | $69,885 |
| 2022 | $1,989 | $72,120 | $10,890 | $61,230 |
| 2021 | $1,732 | $56,742 | $10,890 | $45,852 |
| 2020 | $1,696 | $55,158 | $9,306 | $45,852 |
| 2019 | $1,683 | $54,115 | $9,306 | $44,809 |
| 2018 | $1,614 | $51,746 | $8,514 | $43,232 |
| 2017 | $1,486 | $51,610 | $7,920 | $43,690 |
| 2016 | $1,275 | $44,418 | $7,920 | $36,498 |
| 2015 | $1,275 | $44,418 | $7,920 | $36,498 |
| 2014 | $1,347 | $46,621 | $9,331 | $37,290 |
| 2013 | -- | $46,621 | $9,331 | $37,290 |
Source: Public Records
Map
Nearby Homes
- 397 W L Williams Rd
- 395 W L Williams Rd
- 16 W L Williams Rd
- 14 W L Williams Rd
- 399 W L Williams Rd
- 15 W L Williams Rd
- 9 W L Williams Rd
- 1191 Aderhold Rogers Rd
- 393 W Unit GA 30530
- 1390 Groaning Rock Rd
- 213 Duncan Swindle Rd Unit TRACT 1
- 3655 Neese Commerce Rd
- 1319 Groaning Rock Rd
- 17 Groaning Rock Rd
- 18 Groaning Rock Rd
- 0 Groaning Rock Rd Unit 10617824
- 0 Jot Em Down Rd Unit 10572092
- 0 Jot Em Down Rd Unit 7633000
- 0 Jot Em Down Rd Unit 10572079
- 0 Jot Em Down Tract 3 Rd
- 0 Minish Rd Unit 3160117
- 0 Minish Rd Unit 8428183
- 1642 Neese Commerce Rd
- 1560 Neese Commerce Rd
- 1736 Neese Commerce Rd
- 1481 Commerce Neese Rd
- 1481 Neese Commerce Rd
- 1799 Neese Commerce Rd
- 1406 Settlement Rd
- 122 Minish Rd
- 211 Settlement Rd
- 211 Settlement Rd
- 1911 Neese Commerce Rd
- 1399 Neese Commerce Rd
- 322 Settlement Rd
- 2173 Erastus Church Rd
- 1522 Wl Williams Rd
- 1522 Wl Williams Rd
- 270 Minish Rd
- 1177 Commerce Ln