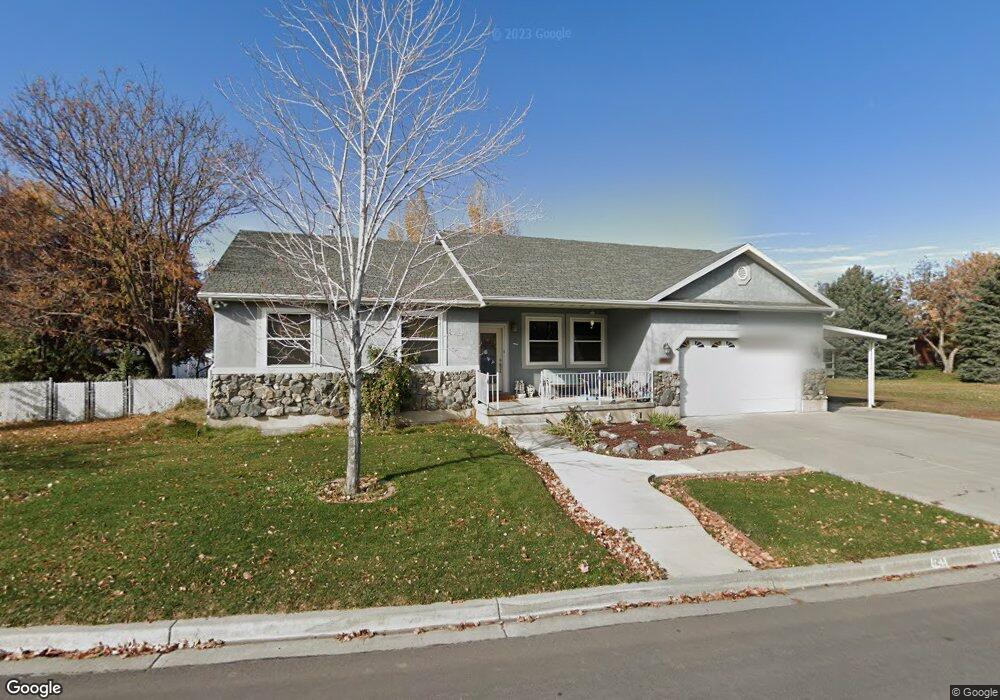
1628 S 500 W Payson, UT 84651
Estimated Value: $553,000 - $583,000
4
Beds
3
Baths
3,158
Sq Ft
$179/Sq Ft
Est. Value
About This Home
This home is located at 1628 S 500 W, Payson, UT 84651 and is currently estimated at $565,519, approximately $179 per square foot. 1628 S 500 W is a home located in Utah County with nearby schools including Spring Lake Elementary, Payson High School, and Payson Junior High School.
Ownership History
Date
Name
Owned For
Owner Type
Purchase Details
Closed on
Mar 30, 2017
Sold by
Elsworth Eric and Elsworth Joan
Bought by
Bigler Gean W and Bigler Lorraine
Current Estimated Value
Purchase Details
Closed on
Mar 8, 2006
Sold by
Terry Michael L and Terry Sara L
Bought by
Ellsworth Eric and Ellsworth Joan
Home Financials for this Owner
Home Financials are based on the most recent Mortgage that was taken out on this home.
Original Mortgage
$227,050
Interest Rate
6.18%
Mortgage Type
New Conventional
Purchase Details
Closed on
Oct 10, 2000
Sold by
Burby Brian A
Bought by
Terry Michael L and Terry Sara L
Purchase Details
Closed on
Apr 28, 2000
Sold by
Steve R Biegler Construction Llc
Bought by
Burby Brian A
Home Financials for this Owner
Home Financials are based on the most recent Mortgage that was taken out on this home.
Original Mortgage
$138,640
Interest Rate
8.27%
Create a Home Valuation Report for This Property
The Home Valuation Report is an in-depth analysis detailing your home's value as well as a comparison with similar homes in the area
Home Values in the Area
Average Home Value in this Area
Purchase History
| Date | Buyer | Sale Price | Title Company |
|---|---|---|---|
| Bigler Gean W | -- | Title West | |
| Ellsworth Eric | -- | Inwest Title Services Inc | |
| Terry Michael L | -- | Wasatch Land & Title | |
| Burby Brian A | -- | Wasatch Land & Title |
Source: Public Records
Mortgage History
| Date | Status | Borrower | Loan Amount |
|---|---|---|---|
| Previous Owner | Ellsworth Eric | $227,050 | |
| Previous Owner | Burby Brian A | $138,640 |
Source: Public Records
Tax History
| Year | Tax Paid | Tax Assessment Tax Assessment Total Assessment is a certain percentage of the fair market value that is determined by local assessors to be the total taxable value of land and additions on the property. | Land | Improvement |
|---|---|---|---|---|
| 2025 | $2,740 | $296,725 | -- | -- |
| 2024 | $2,740 | $278,850 | $0 | $0 |
| 2023 | $2,782 | $283,855 | $0 | $0 |
| 2022 | $2,710 | $271,975 | $0 | $0 |
| 2021 | $2,295 | $369,500 | $116,800 | $252,700 |
| 2020 | $2,177 | $342,800 | $106,200 | $236,600 |
| 2019 | $2,010 | $324,500 | $87,900 | $236,600 |
| 2018 | $1,816 | $282,600 | $76,900 | $205,700 |
| 2017 | $1,722 | $144,100 | $0 | $0 |
| 2016 | $1,685 | $140,085 | $0 | $0 |
| 2015 | $1,607 | $132,715 | $0 | $0 |
| 2014 | $1,476 | $122,760 | $0 | $0 |
Source: Public Records
Map
Nearby Homes
- 609 W Saddlebrook Dr
- 613 W Saddlebrook Dr
- 1631 S Highway 198
- 245 W 1770 S
- 1463 S 260 W
- 1835 S 410 W
- 1589 S 840 W
- 802 Brookside Ct
- 1632 S 240 W Unit 47
- 1652 S 240 W Unit 48
- 1848 S 100 E Unit 3
- 1468 S 910 W
- 1872 S 100 E Unit 6
- 1320 S 950 W
- 1733 S 1100 W
- 582 E 1250 S Unit 137
- 1763 S 1100 W Unit 14
- 1172 S 880 W
- 1333 S 1050 W
- 1338 S 1050 W
- 1628 S 500 W Unit 4
- 1638 S 500 W
- 1638 S 500 W Unit 3
- 1635 S 500 W
- 1635 S 500 W Unit 7
- 1588 S 500 W
- 1645 S 500 W
- 1645 S 500 W Unit 6
- 1648 S 500 W
- 1648 S 500 W Unit 2
- 565 Saddlebrook Dr
- 563 Saddlebrook Dr
- 567 Saddlebrook Dr
- 1655 S 500 W
- 1655 S 500 W Unit 5
- 561 Saddlebrook Dr
- 561 Saddlebrook Dr Unit 22
- 468 W 1650 S
- 1658 S 500 W
- 1658 S 500 W Unit 1
Your Personal Tour Guide
Ask me questions while you tour the home.