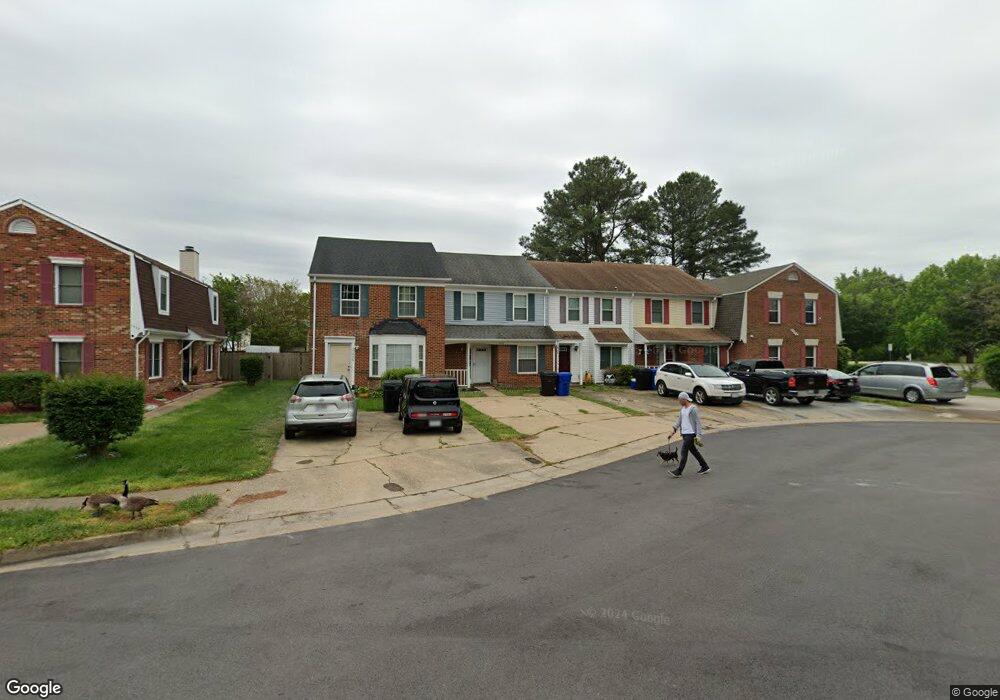
1628 Sudbury Ct Unit Court Virginia Beach, VA 23464
Estimated Value: $271,000 - $285,100
2
Beds
3
Baths
1,360
Sq Ft
$204/Sq Ft
Est. Value
About This Home
This home is located at 1628 Sudbury Ct Unit Court, Virginia Beach, VA 23464 and is currently estimated at $277,775, approximately $204 per square foot. 1628 Sudbury Ct Unit Court is a home located in Virginia Beach City with nearby schools including Providence Elementary School, Salem Middle School, and Salem High School.
Ownership History
Date
Name
Owned For
Owner Type
Purchase Details
Closed on
Sep 23, 2022
Sold by
Dao Thanh M and Dao Quynh T
Bought by
Skluzak Terrence J and Ferra Breanna E
Current Estimated Value
Home Financials for this Owner
Home Financials are based on the most recent Mortgage that was taken out on this home.
Original Mortgage
$225,834
Outstanding Balance
$215,706
Interest Rate
5.22%
Mortgage Type
FHA
Estimated Equity
$62,069
Purchase Details
Closed on
May 27, 2015
Sold by
Pickard Linda G
Bought by
Dao Thanh M
Home Financials for this Owner
Home Financials are based on the most recent Mortgage that was taken out on this home.
Original Mortgage
$153,000
Interest Rate
3.65%
Mortgage Type
New Conventional
Purchase Details
Closed on
May 30, 2000
Sold by
Leach Randol
Bought by
Pickard Linda G
Home Financials for this Owner
Home Financials are based on the most recent Mortgage that was taken out on this home.
Original Mortgage
$69,325
Interest Rate
8.14%
Create a Home Valuation Report for This Property
The Home Valuation Report is an in-depth analysis detailing your home's value as well as a comparison with similar homes in the area
Home Values in the Area
Average Home Value in this Area
Purchase History
| Date | Buyer | Sale Price | Title Company |
|---|---|---|---|
| Skluzak Terrence J | $230,000 | -- | |
| Dao Thanh M | $157,900 | -- | |
| Pickard Linda G | $69,900 | -- |
Source: Public Records
Mortgage History
| Date | Status | Borrower | Loan Amount |
|---|---|---|---|
| Open | Skluzak Terrence J | $225,834 | |
| Previous Owner | Dao Thanh M | $153,000 | |
| Previous Owner | Pickard Linda G | $69,325 |
Source: Public Records
Tax History Compared to Growth
Tax History
| Year | Tax Paid | Tax Assessment Tax Assessment Total Assessment is a certain percentage of the fair market value that is determined by local assessors to be the total taxable value of land and additions on the property. | Land | Improvement |
|---|---|---|---|---|
| 2025 | $2,450 | $279,700 | $80,000 | $199,700 |
| 2024 | $2,450 | $252,600 | $80,000 | $172,600 |
| 2023 | $2,374 | $239,800 | $77,100 | $162,700 |
| 2022 | $2,200 | $222,200 | $67,000 | $155,200 |
| 2021 | $1,907 | $192,600 | $58,000 | $134,600 |
| 2020 | $1,843 | $181,100 | $52,000 | $129,100 |
| 2019 | $1,806 | $174,700 | $49,000 | $125,700 |
| 2018 | $1,751 | $174,700 | $49,000 | $125,700 |
| 2017 | $1,661 | $165,700 | $47,000 | $118,700 |
| 2016 | $1,519 | $153,400 | $43,000 | $110,400 |
| 2015 | $1,265 | $127,800 | $43,000 | $84,800 |
| 2014 | -- | $133,400 | $47,000 | $86,400 |
Source: Public Records
Map
Nearby Homes
- 5276 Settlers Park Dr
- 5250 Settlers Park Dr
- 1630 Jameson Dr
- 5126 Settlers Park Dr
- 5102 Settlers Park Dr
- 1716 Chilhowie Cir
- 1617 Sweet Bay Ct
- 1593 Mill Oak Dr
- 5254 Lake Victoria Arch
- 5029 Hillswick Dr
- 4905 Hillswick Dr
- 1408 Ships Landing
- 5151 Westerly Dr
- 5441 Brookfield Dr
- 4972 Montrose Dr
- 1550 Sangaree Cir
- 1488 Coolspring Way
- 1367 Hafford Rd
- 1445 Marmora Rd
- 1340 Burlington Rd
- 1630 Sudbury Ct
- 1632 Sudbury Ct
- 1628 Sudbury Ct
- 1626 Sudbury Ct
- 1634 Sudbury Ct
- 1624 Sudbury Ct
- 1622 Sudbury Ct
- 5246 Westhaven Crescent
- 5244 Westhaven Crescent
- 5242 Westhaven Crescent
- 5240 Westhaven Crescent
- 5248 Westhaven Crescent
- 1620 Sudbury Ct
- 5238 Westhaven Crescent
- 1618 Sudbury Ct
- 5236 Westhaven Crescent
- 1616 Sudbury Ct
- 5234 Westhaven Crescent
- 1629 Sudbury Ct
- 1627 Sudbury Ct