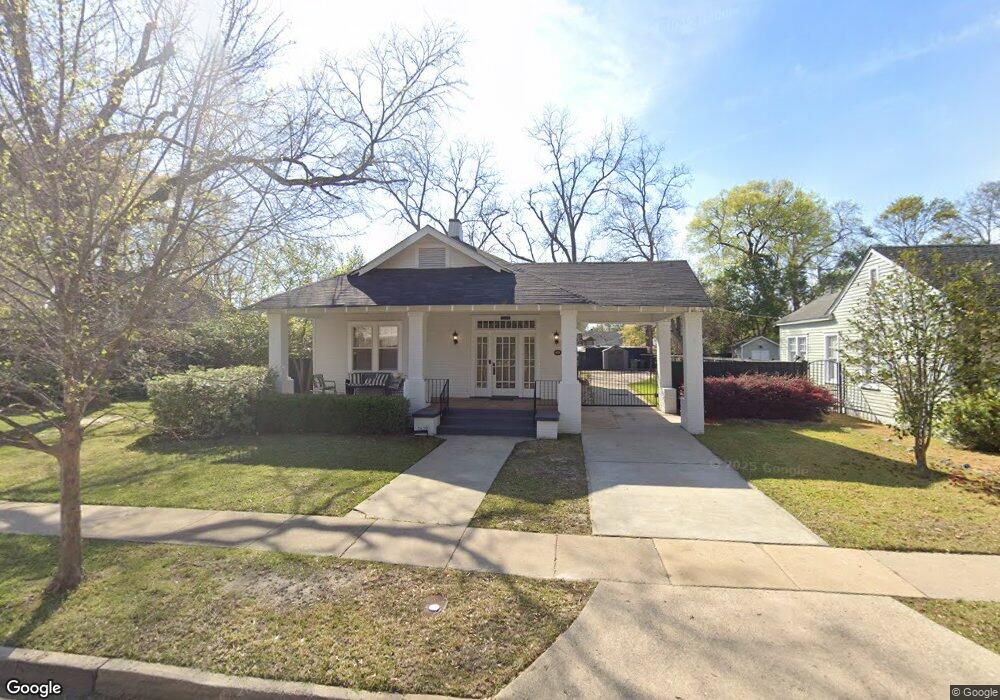
1629 16th Ave Columbus, GA 31901
Saint Elmo Weracoba NeighborhoodEstimated Value: $195,852 - $273,000
2
Beds
2
Baths
1,488
Sq Ft
$155/Sq Ft
Est. Value
About This Home
This home is located at 1629 16th Ave, Columbus, GA 31901 and is currently estimated at $229,963, approximately $154 per square foot. 1629 16th Ave is a home located in Muscogee County with nearby schools including Richards Middle School, Jordan Vocational High School, and Wynnton Elementary School.
Ownership History
Date
Name
Owned For
Owner Type
Purchase Details
Closed on
Apr 3, 2020
Sold by
Lingo Andrew Cannington
Bought by
Lingo Andrew Cannington and Raines Carol Marie
Current Estimated Value
Home Financials for this Owner
Home Financials are based on the most recent Mortgage that was taken out on this home.
Original Mortgage
$140,000
Outstanding Balance
$123,550
Interest Rate
3.2%
Mortgage Type
New Conventional
Estimated Equity
$106,413
Purchase Details
Closed on
Sep 18, 2015
Sold by
Ritchie Lori Waddail
Bought by
Johnson Toney W and Johnson Cheryl M
Home Financials for this Owner
Home Financials are based on the most recent Mortgage that was taken out on this home.
Original Mortgage
$63,750
Interest Rate
3.97%
Mortgage Type
New Conventional
Purchase Details
Closed on
Jun 3, 2015
Sold by
Clement Mary Ellen
Bought by
Ritchie Lori Waddail and Pissanos Becky Waddail
Create a Home Valuation Report for This Property
The Home Valuation Report is an in-depth analysis detailing your home's value as well as a comparison with similar homes in the area
Home Values in the Area
Average Home Value in this Area
Purchase History
| Date | Buyer | Sale Price | Title Company |
|---|---|---|---|
| Lingo Andrew Cannington | $175,000 | -- | |
| Lingo Andrew Cannington | $175,000 | -- | |
| Johnson Toney W | $85,000 | -- | |
| Ritchie Lori Waddail | -- | -- |
Source: Public Records
Mortgage History
| Date | Status | Borrower | Loan Amount |
|---|---|---|---|
| Open | Lingo Andrew Cannington | $140,000 | |
| Closed | Lingo Andrew Cannington | $140,000 | |
| Previous Owner | Johnson Toney W | $63,750 |
Source: Public Records
Tax History
| Year | Tax Paid | Tax Assessment Tax Assessment Total Assessment is a certain percentage of the fair market value that is determined by local assessors to be the total taxable value of land and additions on the property. | Land | Improvement |
|---|---|---|---|---|
| 2025 | $2,704 | $69,080 | $10,332 | $58,748 |
| 2024 | $1,737 | $69,080 | $10,332 | $58,748 |
| 2023 | $1,053 | $69,080 | $10,332 | $58,748 |
| 2022 | $1,811 | $56,532 | $10,332 | $46,200 |
| 2021 | $1,804 | $57,576 | $10,332 | $47,244 |
| 2020 | $2,115 | $51,784 | $10,332 | $41,452 |
| 2019 | $2,122 | $51,784 | $10,332 | $41,452 |
| 2018 | $2,122 | $51,784 | $10,332 | $41,452 |
| 2017 | $2,028 | $49,352 | $10,332 | $39,020 |
| 2016 | $1,402 | $33,999 | $8,297 | $25,702 |
| 2015 | $818 | $49,500 | $10,800 | $38,700 |
| 2014 | $998 | $49,500 | $10,800 | $38,700 |
| 2013 | -- | $49,500 | $10,800 | $38,700 |
Source: Public Records
Map
Nearby Homes
Your Personal Tour Guide
Ask me questions while you tour the home.