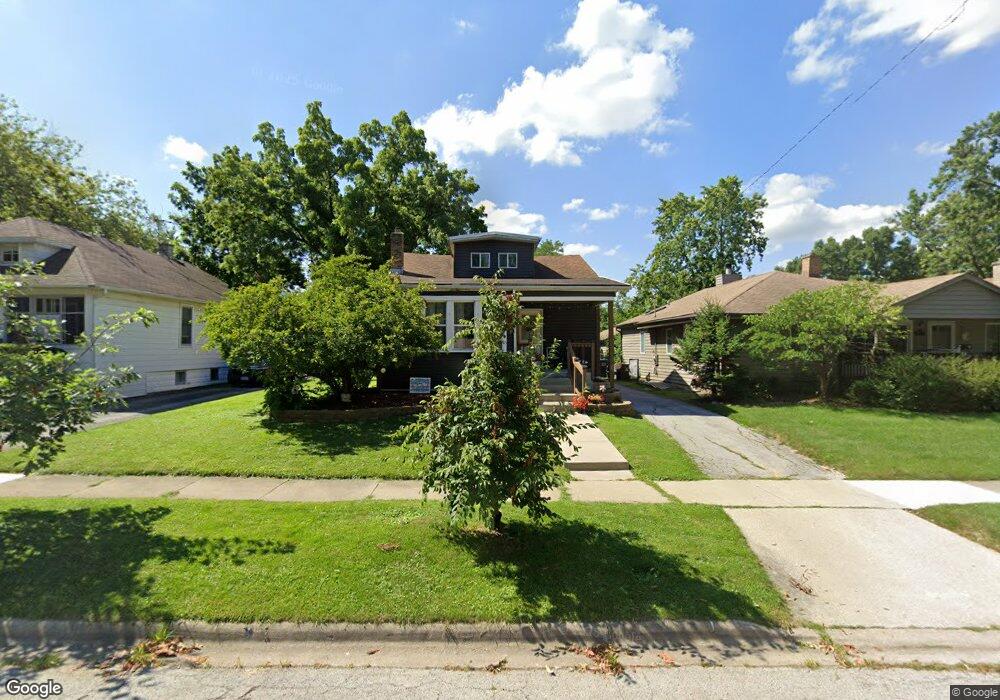
1629 Burr Oak Rd Homewood, IL 60430
Estimated Value: $286,340 - $300,000
3
Beds
2
Baths
1,757
Sq Ft
$167/Sq Ft
Est. Value
About This Home
This home is located at 1629 Burr Oak Rd, Homewood, IL 60430 and is currently estimated at $292,585, approximately $166 per square foot. 1629 Burr Oak Rd is a home located in Cook County with nearby schools including Willow Elementary School, Winston Churchill School, and James Hart School.
Ownership History
Date
Name
Owned For
Owner Type
Purchase Details
Closed on
Mar 16, 2008
Sold by
Wilson James P and Wilson Kathy A
Bought by
Wilson James P and Kathy A Wilson Family Trust
Current Estimated Value
Purchase Details
Closed on
Jul 12, 2002
Sold by
Coopers True/Fit Partnership
Bought by
Wilson James P and Wilson Kathy A
Home Financials for this Owner
Home Financials are based on the most recent Mortgage that was taken out on this home.
Original Mortgage
$86,400
Outstanding Balance
$35,429
Interest Rate
6.25%
Estimated Equity
$257,156
Purchase Details
Closed on
Sep 28, 2001
Sold by
Koch Nicholas J and Koch Julie A
Bought by
Coopers True Fit Partnership
Purchase Details
Closed on
Dec 9, 1999
Sold by
Bank Of Homewood
Bought by
Koch Nicholas J and Koch Julie A
Home Financials for this Owner
Home Financials are based on the most recent Mortgage that was taken out on this home.
Original Mortgage
$69,600
Interest Rate
8.21%
Create a Home Valuation Report for This Property
The Home Valuation Report is an in-depth analysis detailing your home's value as well as a comparison with similar homes in the area
Home Values in the Area
Average Home Value in this Area
Purchase History
| Date | Buyer | Sale Price | Title Company |
|---|---|---|---|
| Wilson James P | -- | None Available | |
| Wilson James P | $108,000 | -- | |
| Coopers True Fit Partnership | $85,000 | -- | |
| Koch Nicholas J | $97,000 | -- |
Source: Public Records
Mortgage History
| Date | Status | Borrower | Loan Amount |
|---|---|---|---|
| Open | Wilson James P | $86,400 | |
| Previous Owner | Koch Nicholas J | $69,600 |
Source: Public Records
Tax History Compared to Growth
Tax History
| Year | Tax Paid | Tax Assessment Tax Assessment Total Assessment is a certain percentage of the fair market value that is determined by local assessors to be the total taxable value of land and additions on the property. | Land | Improvement |
|---|---|---|---|---|
| 2024 | $10,560 | $26,467 | $4,155 | $22,312 |
| 2023 | $10,108 | $28,825 | $4,155 | $24,670 |
| 2022 | $10,108 | $20,667 | $3,636 | $17,031 |
| 2021 | $7,759 | $18,841 | $3,635 | $15,206 |
| 2020 | $4,461 | $12,315 | $3,635 | $8,680 |
| 2019 | $3,608 | $10,616 | $3,376 | $7,240 |
| 2018 | $3,490 | $10,616 | $3,376 | $7,240 |
| 2017 | $3,523 | $10,616 | $3,376 | $7,240 |
| 2016 | $3,736 | $10,022 | $3,116 | $6,906 |
| 2015 | $3,639 | $10,022 | $3,116 | $6,906 |
| 2014 | $3,597 | $10,022 | $3,116 | $6,906 |
| 2013 | $4,006 | $11,670 | $3,116 | $8,554 |
Source: Public Records
Map
Nearby Homes
- 1624 Burr Oak Rd
- 1525 Burr Oak Rd
- 1758 Pine Rd
- 17919 Homewood Ave
- 1850 Pine Rd
- 1728 Olive Rd
- 1554 Olive Rd
- 17739 Harwood Ave
- 1852 Sycamore Rd
- 17833 Harwood Ave
- 1750 183rd St
- 1617 183rd St
- 1607 183rd St
- 1655 183rd St
- 18241 Gottschalk Ave
- 1214 Ridge Rd
- 18110 Center Ave
- 1741 Evergreen Rd
- 18137 Martin Ave Unit 1NE
- 1940 183rd St Unit 1C
- 1625 Burr Oak Rd
- 1635 Burr Oak Rd
- 1621 Burr Oak Rd
- 1639 Burr Oak Rd
- 1615 Burr Oak Rd
- 1645 Burr Oak Rd
- 1630 Linden Rd
- 1636 Linden Rd
- 1628 Linden Rd
- 1649 Burr Oak Rd
- 1620 Linden Rd
- 1640 Linden Rd
- 1607 Burr Oak Rd
- 17950 Ashland Ave
- 1644 Linden Rd
- 1646 Burr Oak Rd
- 1630 Burr Oak Rd
- 1655 Burr Oak Rd
- 1634 Burr Oak Rd
- 1620 Burr Oak Rd