1629 N F St Elwood, IN 46036
Estimated Value: $246,000 - $283,000
3
Beds
2
Baths
1,976
Sq Ft
$134/Sq Ft
Est. Value
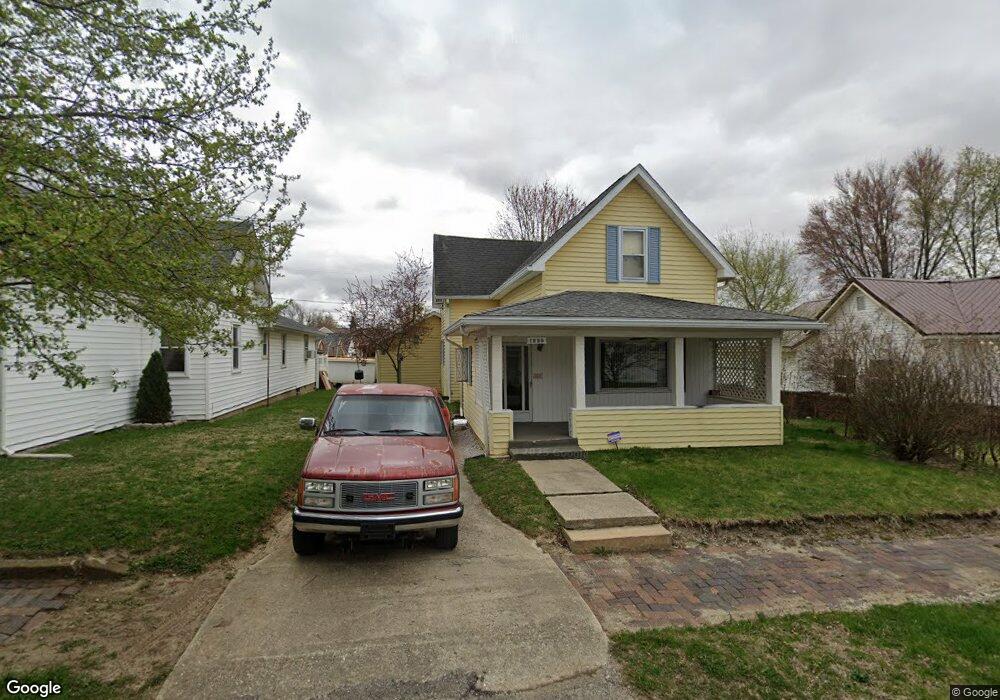
About This Home
This home is located at 1629 N F St, Elwood, IN 46036 and is currently estimated at $263,982, approximately $133 per square foot. 1629 N F St is a home located in Madison County with nearby schools including Elwood Elementary School, Elwood Intermediate School, and Elwood Junior-Senior High School.
Ownership History
Date
Name
Owned For
Owner Type
Purchase Details
Closed on
Mar 25, 2025
Sold by
Chriss Family Revocable Trust and Chriss Craig W
Bought by
Shuler Rickey and Shuler Vanda G
Current Estimated Value
Home Financials for this Owner
Home Financials are based on the most recent Mortgage that was taken out on this home.
Original Mortgage
$240,350
Outstanding Balance
$238,700
Interest Rate
6.87%
Mortgage Type
New Conventional
Estimated Equity
$25,282
Create a Home Valuation Report for This Property
The Home Valuation Report is an in-depth analysis detailing your home's value as well as a comparison with similar homes in the area
Home Values in the Area
Average Home Value in this Area
Purchase History
| Date | Buyer | Sale Price | Title Company |
|---|---|---|---|
| Shuler Rickey | -- | None Listed On Document |
Source: Public Records
Mortgage History
| Date | Status | Borrower | Loan Amount |
|---|---|---|---|
| Open | Shuler Rickey | $240,350 |
Source: Public Records
Tax History Compared to Growth
Tax History
| Year | Tax Paid | Tax Assessment Tax Assessment Total Assessment is a certain percentage of the fair market value that is determined by local assessors to be the total taxable value of land and additions on the property. | Land | Improvement |
|---|---|---|---|---|
| 2025 | $770 | $106,700 | $8,400 | $98,300 |
| 2024 | $770 | $106,700 | $8,400 | $98,300 |
| 2023 | $806 | $100,000 | $7,900 | $92,100 |
| 2022 | $874 | $99,700 | $7,600 | $92,100 |
| 2021 | $732 | $91,600 | $7,600 | $84,000 |
| 2020 | $626 | $84,500 | $7,200 | $77,300 |
| 2019 | $632 | $84,300 | $7,200 | $77,100 |
| 2018 | $660 | $86,300 | $7,200 | $79,100 |
| 2017 | $626 | $86,100 | $7,200 | $78,900 |
| 2016 | $519 | $80,000 | $7,200 | $72,800 |
| 2014 | $486 | $78,600 | $7,200 | $71,400 |
| 2013 | $486 | $80,600 | $7,200 | $73,400 |
Source: Public Records
Map
Nearby Homes
- 523 N 16th St
- xxx N D St
- 611 N Anderson St
- 615 N Anderson St
- 616 N Anderson St
- 0 N 14th St
- 513 N 13th St
- 418 N 14th St
- 1300 N F St
- 850 N Anderson St
- 2024 N B St
- 1001 N 14th St
- 2107 N C St
- 1605 N K St
- 0 12 St N Unit MBR22066123
- 828 N 13th St
- 904 N 13th St
- 853 N 12th St
- 2111 S A St
- 0 N C St at N 10th St