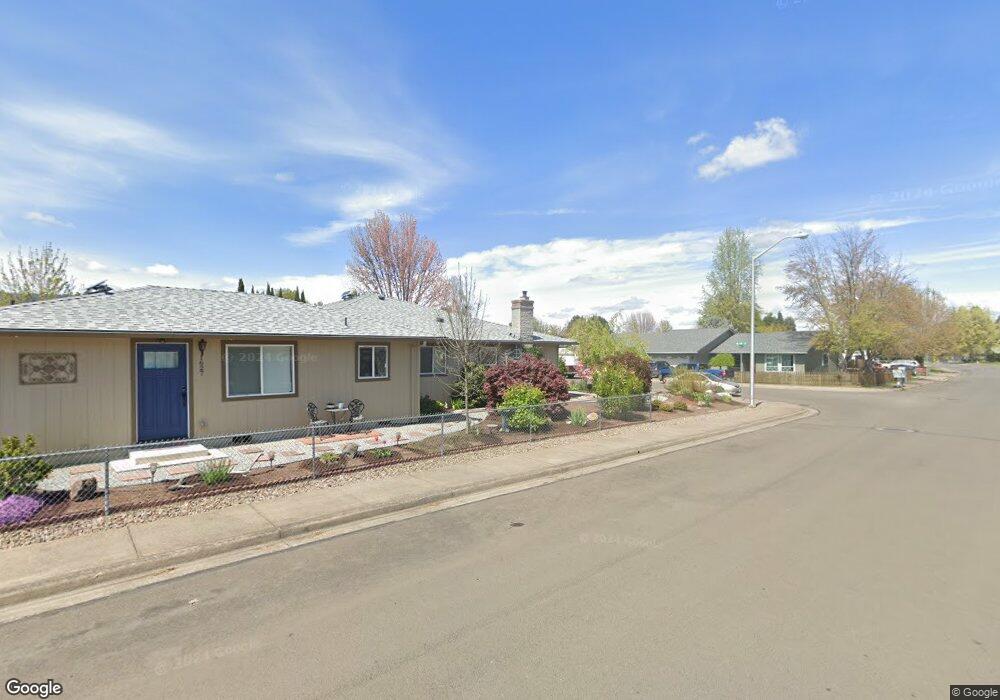
1629 Tara Cir Central Point, OR 97502
Estimated Value: $414,000 - $461,000
3
Beds
2
Baths
1,556
Sq Ft
$281/Sq Ft
Est. Value
About This Home
This home is located at 1629 Tara Cir, Central Point, OR 97502 and is currently estimated at $436,771, approximately $280 per square foot. 1629 Tara Cir is a home located in Jackson County with nearby schools including Richardson Elementary School, Scenic Middle School, and Crater High School.
Ownership History
Date
Name
Owned For
Owner Type
Purchase Details
Closed on
Apr 5, 2021
Sold by
Fry Bruce R and Fry Lenore J
Bought by
Fry Bruce R and Fry Lenore J
Current Estimated Value
Home Financials for this Owner
Home Financials are based on the most recent Mortgage that was taken out on this home.
Original Mortgage
$81,000
Outstanding Balance
$60,685
Interest Rate
2.9%
Mortgage Type
New Conventional
Estimated Equity
$376,086
Purchase Details
Closed on
Jun 22, 2017
Sold by
Tellez Albert and Tellez Anita H
Bought by
Fry Bruce R and Fry Lenore J
Home Financials for this Owner
Home Financials are based on the most recent Mortgage that was taken out on this home.
Original Mortgage
$228,000
Outstanding Balance
$189,648
Interest Rate
4.02%
Mortgage Type
New Conventional
Estimated Equity
$247,123
Create a Home Valuation Report for This Property
The Home Valuation Report is an in-depth analysis detailing your home's value as well as a comparison with similar homes in the area
Home Values in the Area
Average Home Value in this Area
Purchase History
| Date | Buyer | Sale Price | Title Company |
|---|---|---|---|
| Fry Bruce R | -- | Amrock Llc | |
| Fry Bruce R | -- | Amrock Llc | |
| Fry Bruce R | $240,000 | Amerititle |
Source: Public Records
Mortgage History
| Date | Status | Borrower | Loan Amount |
|---|---|---|---|
| Open | Fry Bruce R | $81,000 | |
| Open | Fry Bruce R | $228,000 |
Source: Public Records
Tax History Compared to Growth
Tax History
| Year | Tax Paid | Tax Assessment Tax Assessment Total Assessment is a certain percentage of the fair market value that is determined by local assessors to be the total taxable value of land and additions on the property. | Land | Improvement |
|---|---|---|---|---|
| 2025 | $4,148 | $249,470 | $62,830 | $186,640 |
| 2024 | $4,148 | $242,210 | $61,000 | $181,210 |
| 2023 | $4,014 | $235,160 | $59,220 | $175,940 |
| 2022 | $3,921 | $235,160 | $59,220 | $175,940 |
| 2021 | $3,809 | $228,320 | $57,500 | $170,820 |
| 2020 | $3,698 | $221,670 | $55,820 | $165,850 |
| 2019 | $3,607 | $208,960 | $52,620 | $156,340 |
| 2018 | $3,077 | $178,510 | $51,090 | $127,420 |
| 2017 | $2,999 | $178,510 | $51,090 | $127,420 |
| 2016 | $2,912 | $168,280 | $48,170 | $120,110 |
| 2015 | $2,790 | $168,280 | $48,170 | $120,110 |
| 2014 | $2,605 | $158,630 | $45,400 | $113,230 |
Source: Public Records
Map
Nearby Homes
- 3364 Snowy Butte Ln
- 871 Holley Way
- 895 Holley Way
- 739 S Haskell St
- 887 Silver Fox Dr
- 114 Cedar St
- 659 Jackson Creek Dr
- 487 Creekside Cir
- 349 W Pine St
- 465 Creekside Cir
- 755 S 4th St
- 21 Hickory Ln
- 350 Alder St
- 1065 Edwina Ave
- 531 Bush St
- 3496 Edella St
- 619 Palo Verde Way
- 3364 Bursell Rd
- 715 Ash St
- 555 Freeman Rd Unit 128