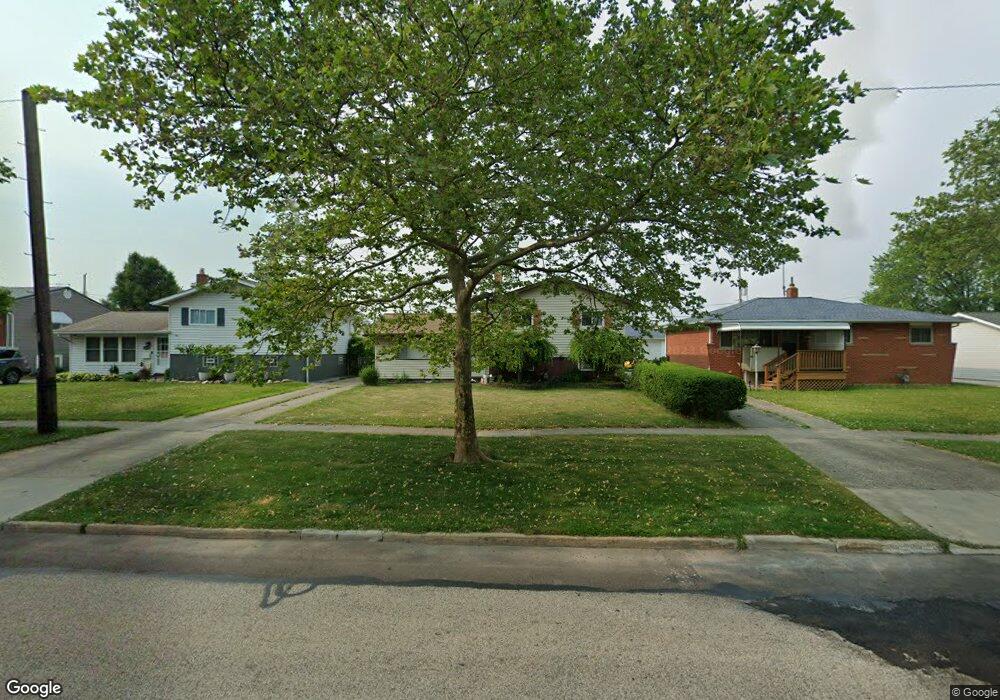
16291 Holland Rd Brookpark, OH 44142
Estimated Value: $214,103 - $237,000
3
Beds
1
Bath
1,540
Sq Ft
$149/Sq Ft
Est. Value
About This Home
This home is located at 16291 Holland Rd, Brookpark, OH 44142 and is currently estimated at $229,276, approximately $148 per square foot. 16291 Holland Rd is a home located in Cuyahoga County with nearby schools including Berea-Midpark Middle School, Berea-Midpark High School, and Huber Heights Preparatory Academy Parma Academy.
Ownership History
Date
Name
Owned For
Owner Type
Purchase Details
Closed on
Jul 26, 2025
Sold by
Calame Charles N and Calame Danina
Bought by
Calame Charles N and Calame Danina
Current Estimated Value
Home Financials for this Owner
Home Financials are based on the most recent Mortgage that was taken out on this home.
Original Mortgage
$73,250
Outstanding Balance
$72,996
Interest Rate
5.89%
Mortgage Type
New Conventional
Estimated Equity
$156,280
Purchase Details
Closed on
Oct 21, 2002
Sold by
Pittman Thomas O and Pittman Diane
Bought by
Calame Charles N
Home Financials for this Owner
Home Financials are based on the most recent Mortgage that was taken out on this home.
Original Mortgage
$134,300
Interest Rate
6.29%
Mortgage Type
FHA
Purchase Details
Closed on
Mar 24, 2000
Sold by
Bartosiewicz Stanislaw M and Ewa Bartosiewicz
Bought by
Calame Charles N and Pittman Thomas O
Home Financials for this Owner
Home Financials are based on the most recent Mortgage that was taken out on this home.
Original Mortgage
$132,413
Interest Rate
8.39%
Mortgage Type
FHA
Purchase Details
Closed on
Mar 8, 1994
Sold by
Valiante Roy
Bought by
Bartosiewicz Stanislaw M
Purchase Details
Closed on
Jan 1, 1975
Bought by
Valiante Roy
Create a Home Valuation Report for This Property
The Home Valuation Report is an in-depth analysis detailing your home's value as well as a comparison with similar homes in the area
Home Values in the Area
Average Home Value in this Area
Purchase History
| Date | Buyer | Sale Price | Title Company |
|---|---|---|---|
| Calame Charles N | -- | First Source Title | |
| Calame Charles N | -- | American Title & Trust | |
| Calame Charles N | $132,500 | Wrta | |
| Bartosiewicz Stanislaw M | $92,500 | -- | |
| Valiante Roy | -- | -- |
Source: Public Records
Mortgage History
| Date | Status | Borrower | Loan Amount |
|---|---|---|---|
| Open | Calame Charles N | $73,250 | |
| Previous Owner | Calame Charles N | $134,300 | |
| Previous Owner | Calame Charles N | $132,413 |
Source: Public Records
Tax History Compared to Growth
Tax History
| Year | Tax Paid | Tax Assessment Tax Assessment Total Assessment is a certain percentage of the fair market value that is determined by local assessors to be the total taxable value of land and additions on the property. | Land | Improvement |
|---|---|---|---|---|
| 2024 | $2,991 | $59,290 | $10,675 | $48,615 |
| 2023 | $3,145 | $51,630 | $8,680 | $42,950 |
| 2022 | $3,123 | $51,630 | $8,680 | $42,950 |
| 2021 | $3,104 | $51,630 | $8,680 | $42,950 |
| 2020 | $2,800 | $40,990 | $6,900 | $34,090 |
| 2019 | $2,717 | $117,100 | $19,700 | $97,400 |
| 2018 | $2,705 | $40,990 | $6,900 | $34,090 |
| 2017 | $2,717 | $38,020 | $6,410 | $31,610 |
| 2016 | $2,694 | $38,020 | $6,410 | $31,610 |
| 2015 | $2,661 | $38,020 | $6,410 | $31,610 |
| 2014 | $2,661 | $40,010 | $6,760 | $33,250 |
Source: Public Records
Map
Nearby Homes
- 16051 Holland Rd
- 15924 Richard Dr
- 6378 Edgehurst Dr
- 6470 Sandfield Dr
- 16193 Emerald Point Unit 16193
- 6054 Langer Dr
- 6195 Hardin Dr
- 15446 Sheldon Rd
- 14890 Holland Rd
- 17810 Engle Ct
- 6577 Liberty Bell Dr Unit 20C
- 6710 Woodruff Ct
- 15790 Foxglove Ln
- 6728 Benedict Dr
- 6740 Benedict Dr
- 6755 Benedict Dr
- 5966 Engle Rd
- 6736 Columbine Ct
- 6736 Rockridge Ct
- 6748 Benedict Dr
- 16311 Holland Rd
- 16271 Holland Rd
- 16331 Holland Rd
- 16251 Holland Rd
- 16290 Richard Dr
- 16310 Richard Dr
- 16270 Richard Dr
- 16351 Holland Rd
- 16330 Richard Dr
- 16250 Richard Dr
- 16350 Richard Dr
- 16290 Holland Rd
- 16310 Holland Rd
- 16371 Holland Rd
- 16270 Holland Rd
- 16151 Holland Rd
- 16330 Holland Rd
- 16250 Holland Rd
- 16370 Richard Dr
- 16350 Holland Rd