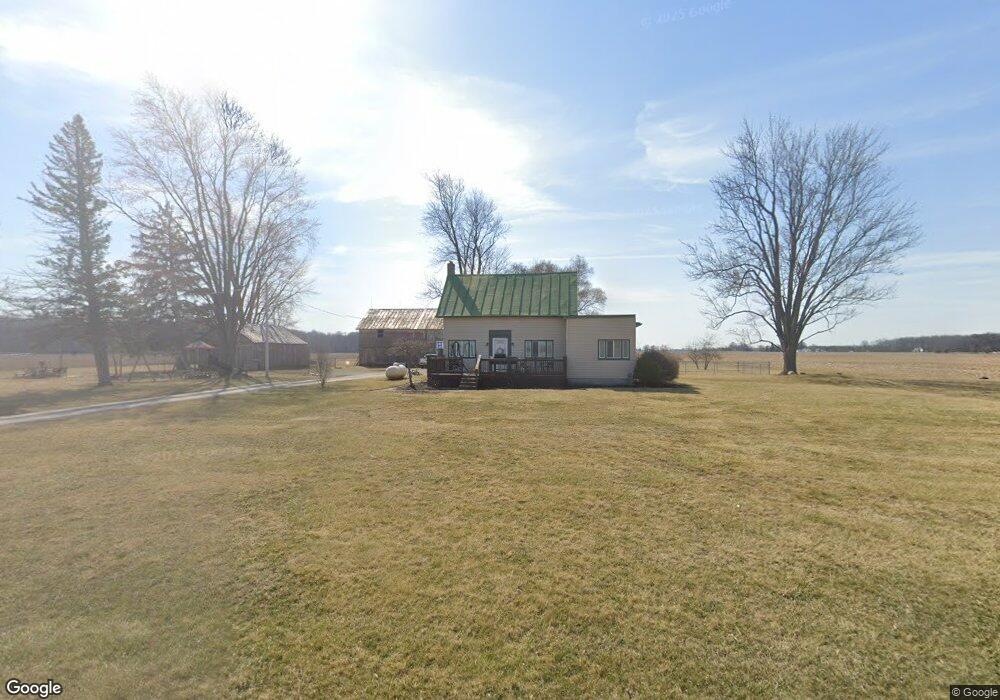
16297 Trail 168 Arlington, OH 45814
Estimated Value: $147,000 - $197,000
3
Beds
1
Bath
1,362
Sq Ft
$129/Sq Ft
Est. Value
About This Home
This home is located at 16297 Trail 168, Arlington, OH 45814 and is currently estimated at $176,358, approximately $129 per square foot. 16297 Trail 168 is a home located in Hancock County with nearby schools including Riverdale Middle School and Riverdale High School.
Ownership History
Date
Name
Owned For
Owner Type
Purchase Details
Closed on
Apr 20, 2020
Sold by
Tribett Sean A and Tribett Cayla E
Bought by
Hammer Matthew and Hammer Chelsea M
Current Estimated Value
Home Financials for this Owner
Home Financials are based on the most recent Mortgage that was taken out on this home.
Original Mortgage
$125,190
Outstanding Balance
$110,308
Interest Rate
3.12%
Mortgage Type
FHA
Estimated Equity
$66,050
Purchase Details
Closed on
Apr 27, 2018
Sold by
Walter Matthew D
Bought by
Tribett Sean A and Tribett Cayla E
Home Financials for this Owner
Home Financials are based on the most recent Mortgage that was taken out on this home.
Original Mortgage
$90,909
Interest Rate
4.44%
Mortgage Type
New Conventional
Purchase Details
Closed on
Dec 10, 2007
Sold by
Fannie Mae
Bought by
Walter Matthew D
Purchase Details
Closed on
Sep 21, 2007
Sold by
Gonzales Amy M and Gmac Mortgage Llc
Bought by
Federal National Mortgage Association
Create a Home Valuation Report for This Property
The Home Valuation Report is an in-depth analysis detailing your home's value as well as a comparison with similar homes in the area
Home Values in the Area
Average Home Value in this Area
Purchase History
| Date | Buyer | Sale Price | Title Company |
|---|---|---|---|
| Hammer Matthew | $127,500 | None Available | |
| Tribett Sean A | $90,000 | Whitman Title Security | |
| Walter Matthew D | $48,500 | Hancock Title Agency | |
| Federal National Mortgage Association | $59,000 | Whitman Title |
Source: Public Records
Mortgage History
| Date | Status | Borrower | Loan Amount |
|---|---|---|---|
| Open | Hammer Matthew | $125,190 | |
| Closed | Tribett Sean A | $90,909 |
Source: Public Records
Tax History Compared to Growth
Tax History
| Year | Tax Paid | Tax Assessment Tax Assessment Total Assessment is a certain percentage of the fair market value that is determined by local assessors to be the total taxable value of land and additions on the property. | Land | Improvement |
|---|---|---|---|---|
| 2024 | $1,089 | $40,090 | $12,740 | $27,350 |
| 2023 | $1,081 | $40,090 | $12,740 | $27,350 |
| 2022 | $1,151 | $40,090 | $12,740 | $27,350 |
| 2021 | $978 | $29,670 | $12,500 | $17,170 |
| 2020 | $975 | $29,670 | $12,500 | $17,170 |
| 2019 | $955 | $29,670 | $12,500 | $17,170 |
| 2018 | $789 | $25,870 | $10,870 | $15,000 |
| 2017 | $836 | $25,870 | $10,870 | $15,000 |
| 2016 | $1,066 | $25,870 | $10,870 | $15,000 |
| 2015 | $490 | $16,150 | $10,870 | $5,280 |
| 2014 | $478 | $16,080 | $10,870 | $5,210 |
| 2012 | $520 | $16,080 | $10,870 | $5,210 |
Source: Public Records
Map
Nearby Homes
- 11955 State Route 37
- 15152 Township Road 190
- 15055 County Road 26
- 11787 County Road 180
- 14610 Township Road 205
- 10770 County Road 180
- 15739 Mallard Ln
- 0 Township Road 227
- 13385 Deer Landing Dr
- 15107 Township Road 208
- 19818 State Route 568
- 112 W Main St
- 1815 Eastview Dr
- 3065 S Main St
- 1726 Eastview Dr
- 1818 Westview Dr
- 1709 Eastview Dr
- 1933 Lippincott Ave
- 311 E Main St
- 0 Blanchard Ave
- 16297 Township Road 168
- 16424 Township Road 168
- 16612 Township Road 168
- 13819 State Route 37
- 13840 State Route 37
- 13840 Ohio 37
- 14060 Ohio 37
- 14060 State Route 37
- 16855 County Road 172
- 13256 County Road 172
- 14175 State Route 37
- 14180 State Route 37
- 15595 Township Road 168
- 14204 State Route 37
- 16099 County Road 172
- 14300 State Route 37
- 15467 Township Road 168
- 14350 Ohio 37
- 14350 State Route 37
- 14350 State Route 37