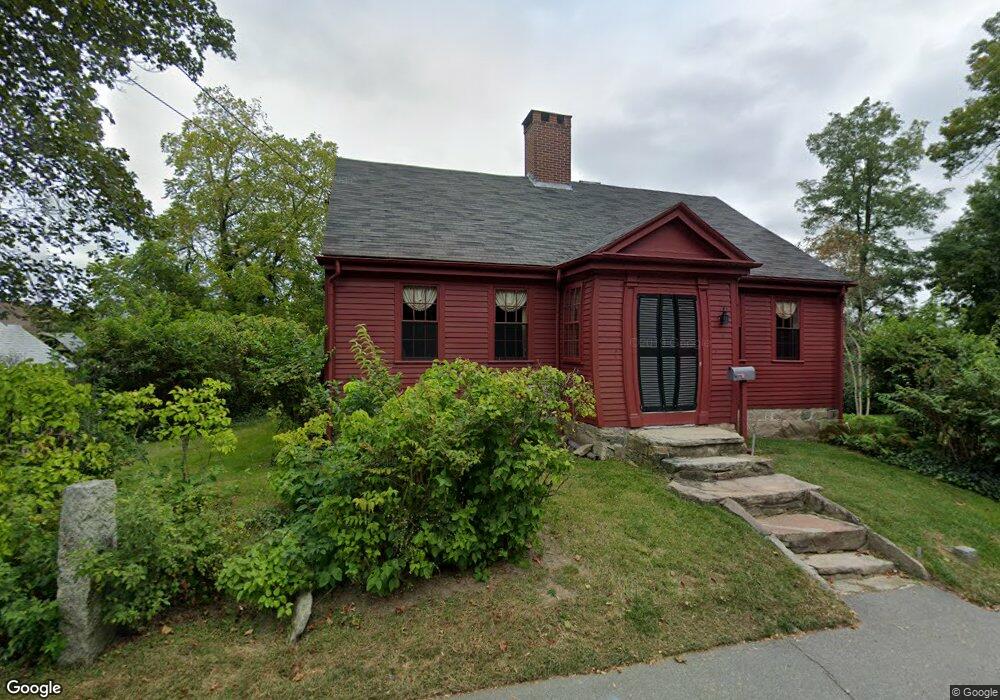
163 Adams St Fairhaven, MA 02719
Oxford NeighborhoodEstimated Value: $443,636 - $511,000
2
Beds
1
Bath
1,336
Sq Ft
$361/Sq Ft
Est. Value
About This Home
This home is located at 163 Adams St, Fairhaven, MA 02719 and is currently estimated at $482,659, approximately $361 per square foot. 163 Adams St is a home located in Bristol County with nearby schools including Fairhaven High School, Alma Del Mar Charter School, and City On A Hill Charter Public School New Bedford.
Ownership History
Date
Name
Owned For
Owner Type
Purchase Details
Closed on
Jan 6, 2005
Sold by
Scott Earl A and Scott Gloria J
Bought by
Hipolito Betty A
Current Estimated Value
Home Financials for this Owner
Home Financials are based on the most recent Mortgage that was taken out on this home.
Original Mortgage
$220,500
Outstanding Balance
$111,327
Interest Rate
5.75%
Mortgage Type
Purchase Money Mortgage
Estimated Equity
$371,332
Create a Home Valuation Report for This Property
The Home Valuation Report is an in-depth analysis detailing your home's value as well as a comparison with similar homes in the area
Home Values in the Area
Average Home Value in this Area
Purchase History
| Date | Buyer | Sale Price | Title Company |
|---|---|---|---|
| Hipolito Betty A | $245,000 | -- |
Source: Public Records
Mortgage History
| Date | Status | Borrower | Loan Amount |
|---|---|---|---|
| Open | Hipolito Betty A | $75,000 | |
| Open | Hipolito Betty A | $220,500 |
Source: Public Records
Tax History
| Year | Tax Paid | Tax Assessment Tax Assessment Total Assessment is a certain percentage of the fair market value that is determined by local assessors to be the total taxable value of land and additions on the property. | Land | Improvement |
|---|---|---|---|---|
| 2025 | $35 | $373,000 | $176,700 | $196,300 |
| 2024 | $3,383 | $366,500 | $176,700 | $189,800 |
| 2023 | $3,138 | $315,400 | $154,800 | $160,600 |
| 2022 | $3,038 | $297,300 | $143,800 | $153,500 |
| 2021 | $2,955 | $261,700 | $130,100 | $131,600 |
| 2020 | $2,894 | $261,700 | $130,100 | $131,600 |
| 2019 | $3,482 | $234,200 | $107,900 | $126,300 |
| 2018 | $5,300 | $224,000 | $102,700 | $121,300 |
| 2017 | $5,174 | $216,700 | $102,700 | $114,000 |
| 2016 | $2,607 | $214,000 | $102,700 | $111,300 |
| 2015 | $2,460 | $202,500 | $102,700 | $99,800 |
Source: Public Records
Map
Nearby Homes
- 442 Dana Farms
- 313 Main St
- 253 Adams St
- 24 Academy Ave
- 15 School St
- 14 Sycamore St
- 10 Livesey Pkwy
- 16 Ash St
- 71 Sycamore St
- 138 Main St Unit 13
- 67 Bridge St
- 39 Christian St
- 77 Adams St
- 7 Deerfield Ln
- 145 Pleasant St
- 0 Nulands Neck Unit 73286360
- 58 Washington St
- 8 Washington St
- 24 Cotter St
- 44 Bernard St
Your Personal Tour Guide
Ask me questions while you tour the home.