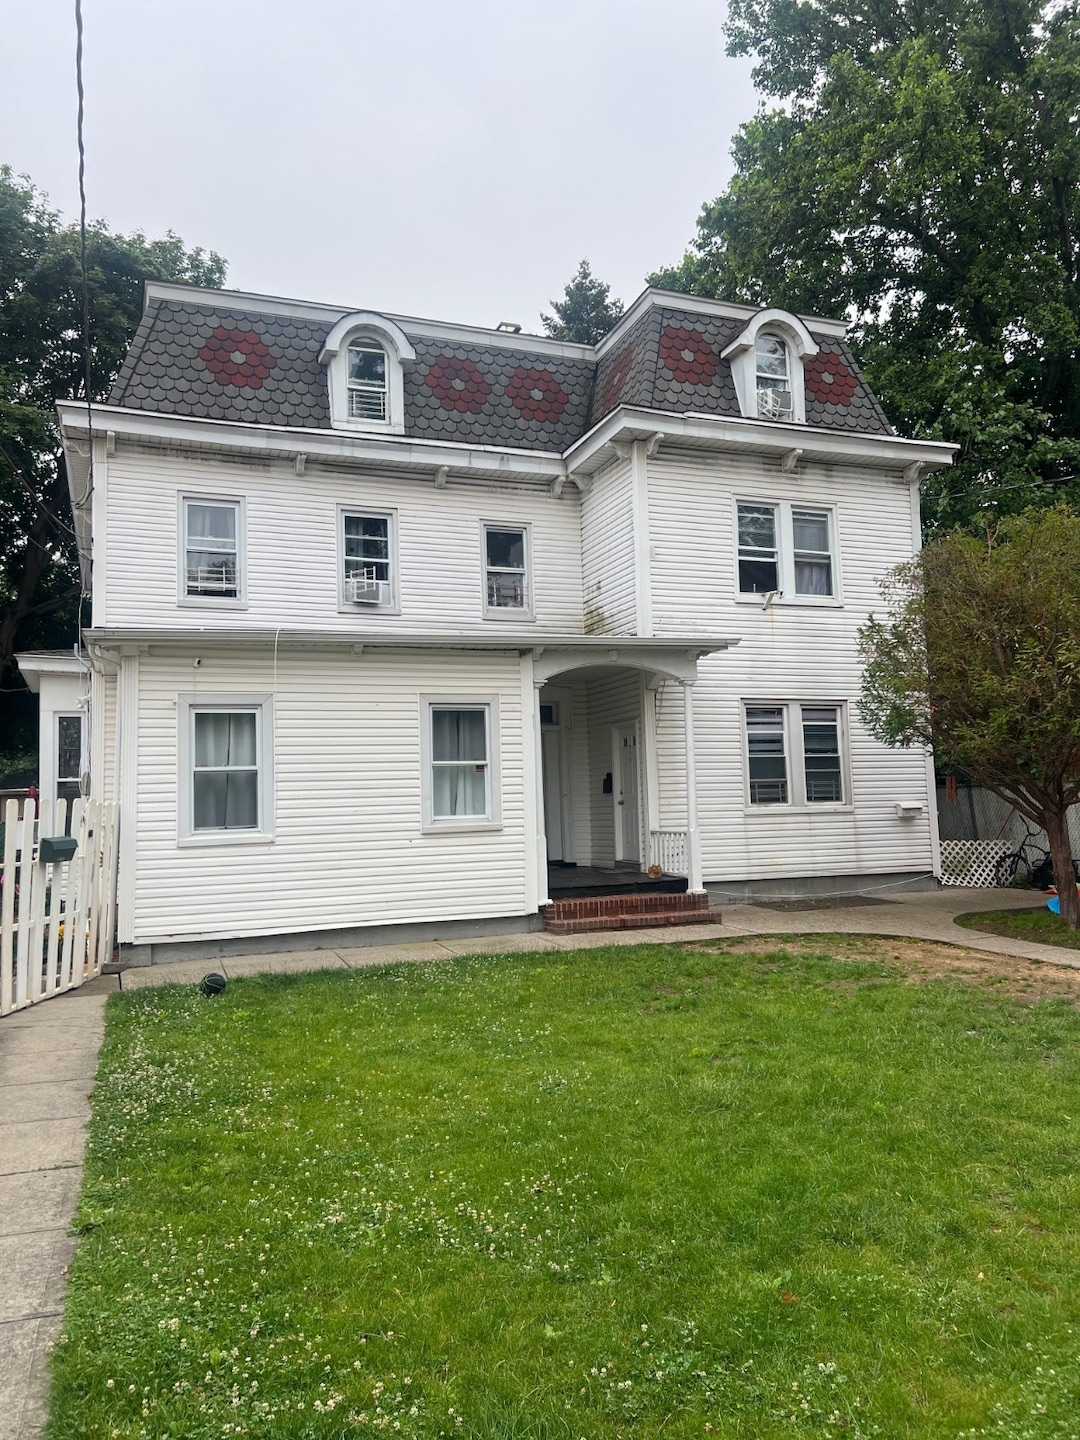
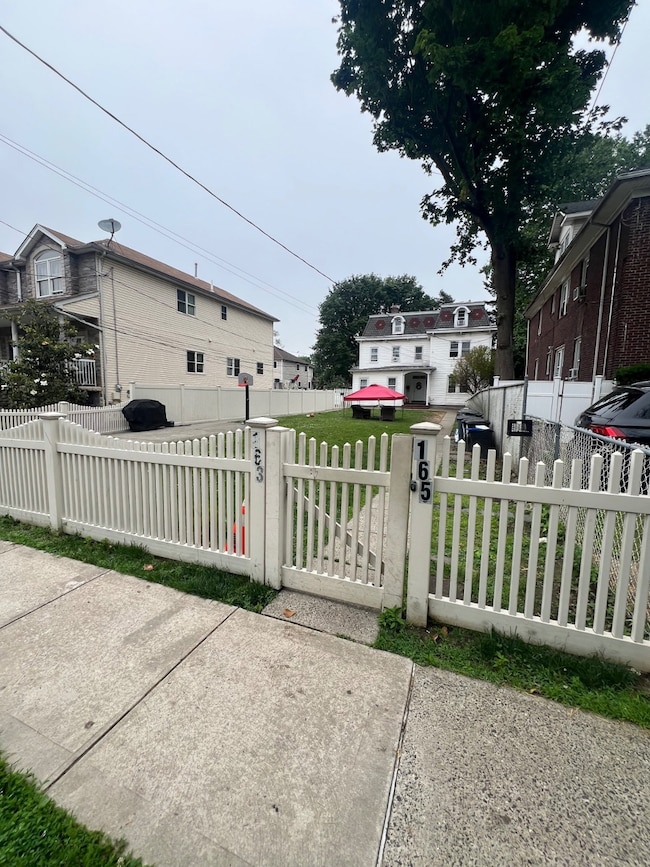
163 Bement Ave Staten Island, NY 10310
West Brighton NeighborhoodEstimated payment $7,757/month
Highlights
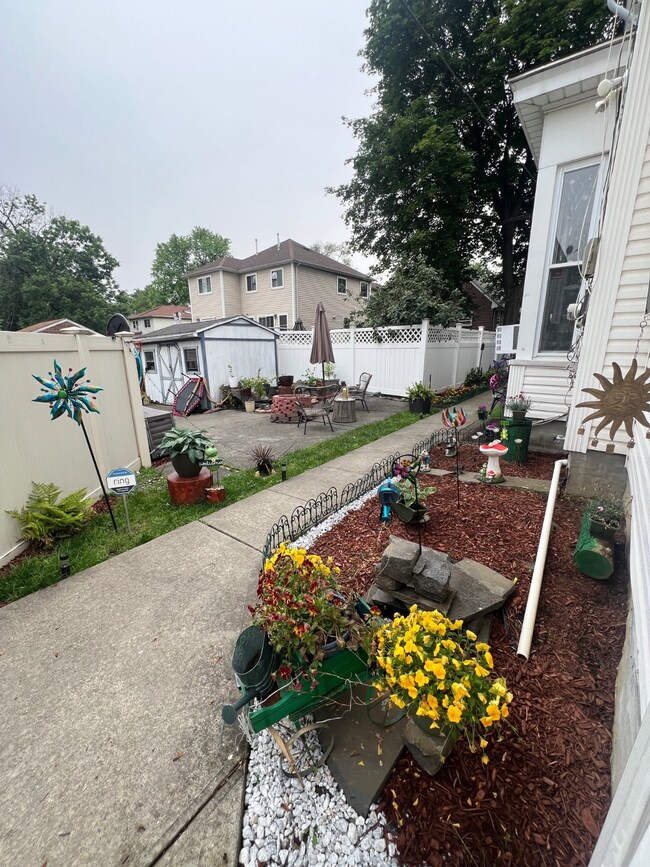
- Water Views
- Colonial Architecture
- Landscaped with Trees
- 7,654 Sq Ft lot
- Wood Flooring
- Property is near bus stop
About This Home
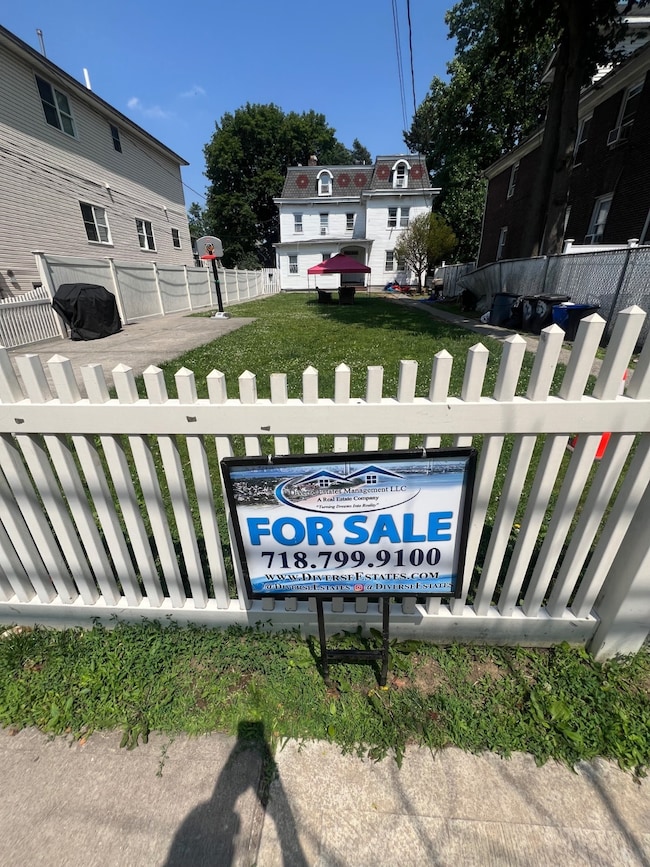
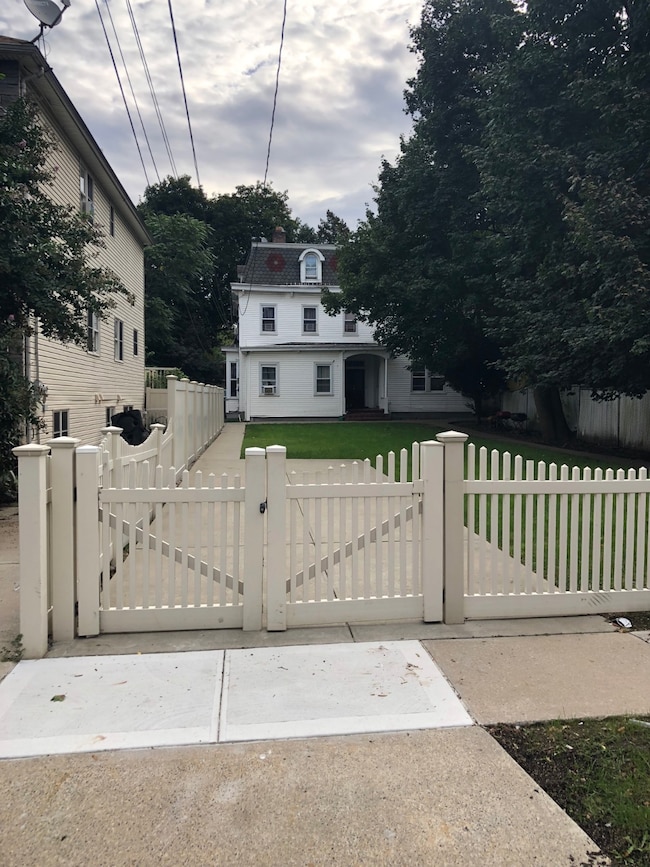
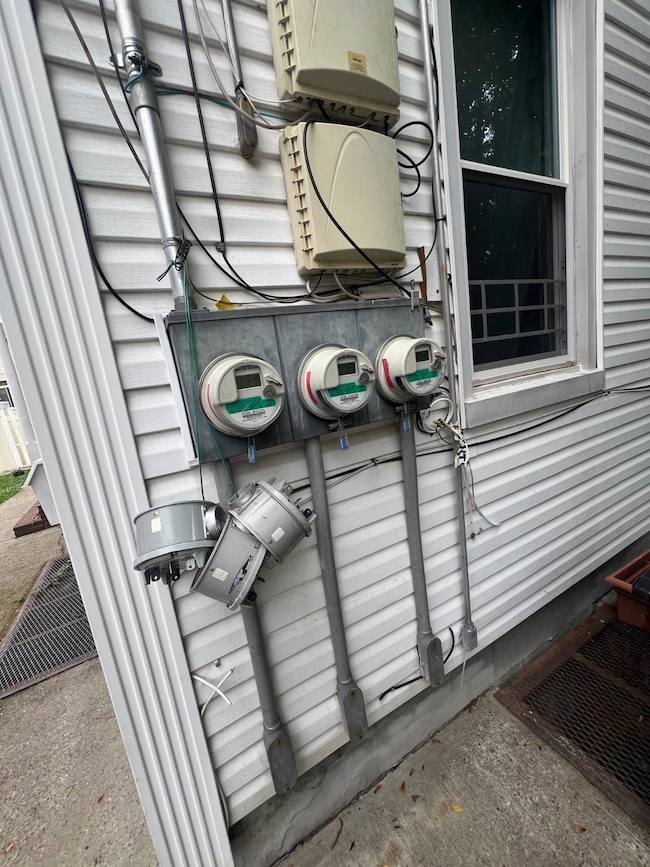
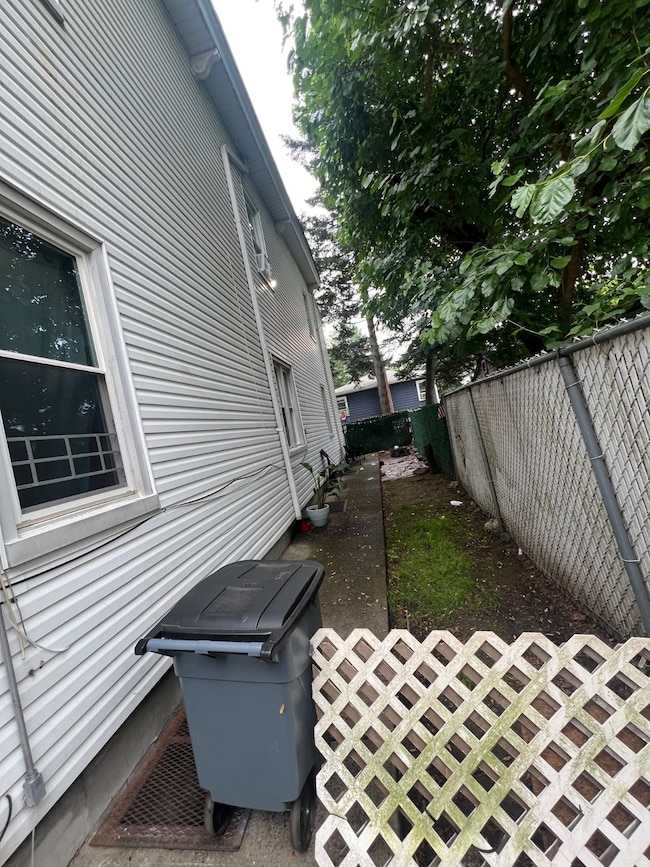
Well maintained Huge 4 Family For sale. Fully fenced private residence setting. Currently fully occupied with tenants. 4 separate heating and electric units for each apartment. Over 12k total rental income which can be increased with new buyer. Property sits several feet from street making it a very quiet setting. About 5 mins from the New Empire Outlets and Staten Island Ferry.
Property Details
Home Type
- Multi-Family
Est. Annual Taxes
- $5,260
Year Renovated
- 2014
Lot Details
- 7,654 Sq Ft Lot
- Fenced
- Landscaped with Trees
Parking
- Driveway
Home Design
- Colonial Architecture
- Rubber Roof
- Masonry Siding
- Vinyl Siding
- Stucco
Interior Spaces
- 4,008 Sq Ft Home
- 3-Story Property
- Wood Flooring
- Water Views
- Unfinished Basement
- Basement Fills Entire Space Under The House
- Fire Sprinkler System
- Oven
Bedrooms and Bathrooms
- 10 Bedrooms
- 5 Full Bathrooms
Location
- Property is near bus stop
Utilities
- Cooling System Mounted To A Wall/Window
- Forced Air Heating System
- Propane Stove
- Heating System Uses Gas
Community Details
- Randall Manor Community
Map
Home Values in the Area
Average Home Value in this Area
Tax History
We collect this data history from publicly available records. To have your information removed, we recommend requesting removal directly through your county’s website.
| Year | Tax Paid | Tax Assessment Tax Assessment Total Assessment is a certain percentage of the fair market value that is determined by local assessors to be the total taxable value of land and additions on the property. | Land | Improvement |
|---|---|---|---|---|
| 2026 | $5,653 | $59,400 | $6,508 | $52,892 |
| 2025 | $5,333 | $63,960 | $5,703 | $58,257 |
| 2024 | $5,333 | $68,280 | $5,040 | $63,240 |
| 2023 | $5,392 | $26,551 | $5,134 | $21,417 |
| 2022 | $5,260 | $60,480 | $12,960 | $47,520 |
| 2021 | $5,231 | $56,820 | $12,960 | $43,860 |
| 2020 | $4,977 | $54,540 | $12,960 | $41,580 |
| 2019 | $4,629 | $47,400 | $12,960 | $34,440 |
| 2018 | $4,510 | $22,126 | $6,458 | $15,668 |
| 2017 | $4,476 | $21,957 | $7,984 | $13,973 |
| 2016 | $4,141 | $20,715 | $9,341 | $11,374 |
| 2015 | $3,539 | $19,544 | $6,248 | $13,296 |
| 2014 | $3,539 | $18,439 | $6,215 | $12,224 |
Property History
We collect this data history from publicly available records. To have your information removed, we recommend requesting removal directly through your county’s website.
| Date | Event | Price | List to Sale | Price per Sq Ft | Prior Sale |
|---|---|---|---|---|---|
| 02/23/2026 02/23/26 | Price Changed | $1,379,000 | -0.1% | $344 / Sq Ft | |
| 01/09/2026 01/09/26 | Price Changed | $1,380,000 | 0.0% | $344 / Sq Ft | |
| 01/09/2026 01/09/26 | For Sale | $1,380,000 | -1.0% | $344 / Sq Ft | |
| 01/01/2026 01/01/26 | Off Market | $1,394,000 | -- | -- | |
| 12/27/2025 12/27/25 | Price Changed | $1,394,000 | -0.1% | $348 / Sq Ft | |
| 12/10/2025 12/10/25 | Price Changed | $1,395,000 | -0.4% | $348 / Sq Ft | |
| 12/01/2025 12/01/25 | Price Changed | $1,400,000 | -0.2% | $349 / Sq Ft | |
| 11/11/2025 11/11/25 | Price Changed | $1,403,000 | -0.1% | $350 / Sq Ft | |
| 10/17/2025 10/17/25 | Price Changed | $1,405,000 | -0.4% | $351 / Sq Ft | |
| 10/05/2025 10/05/25 | Price Changed | $1,410,000 | -0.7% | $352 / Sq Ft | |
| 09/15/2025 09/15/25 | Price Changed | $1,420,000 | -2.1% | $354 / Sq Ft | |
| 08/23/2025 08/23/25 | Price Changed | $1,450,000 | -1.4% | $362 / Sq Ft | |
| 07/17/2025 07/17/25 | Price Changed | $1,470,000 | -1.7% | $367 / Sq Ft | |
| 07/08/2025 07/08/25 | Price Changed | $1,495,000 | -0.3% | $373 / Sq Ft | |
| 06/25/2025 06/25/25 | For Sale | $1,500,000 | +54.6% | $374 / Sq Ft | |
| 03/14/2025 03/14/25 | Sold | $970,000 | -13.8% | $241 / Sq Ft | View Prior Sale |
| 04/03/2024 04/03/24 | Pending | -- | -- | -- | |
| 11/16/2023 11/16/23 | For Sale | $1,125,000 | -- | $280 / Sq Ft |
Purchase History
We collect this data history from publicly available records. To have your information removed, we recommend requesting removal directly through your county’s website.
| Date | Type | Sale Price | Title Company |
|---|---|---|---|
| Bargain Sale Deed | -- | None Listed On Document | |
| Bargain Sale Deed | $1,070,000 | Finest Abstract And Title Serv | |
| Bargain Sale Deed | $593,699 | Webtitle Agency | |
| Bargain Sale Deed | $625,000 | Fidelity Natl Title Ins Co | |
| Bargain Sale Deed | $525,000 | Regal Title |
Mortgage History
We collect this data history from publicly available records. To have your information removed, we recommend requesting removal directly through your county’s website.
| Date | Status | Loan Amount | Loan Type |
|---|---|---|---|
| Previous Owner | $802,500 | New Conventional | |
| Previous Owner | $641,650 | Fannie Mae Freddie Mac | |
| Previous Owner | $300,000 | Purchase Money Mortgage |
Source: NY State MLS
MLS Number: 11524450
APN: 00150-0279
Disclaimer: Certain information contained herein is derived from information provided by parties other than Homes.com. All information provided is deemed reliable, but is not guaranteed to be accurate and should be independently verified.
![]() IDX information is provided exclusively for personal, non-commercial use, and may not be used for any purpose other than to identify prospective properties consumers may be interested in purchasing. Information is deemed reliable but not guaranteed.
IDX information is provided exclusively for personal, non-commercial use, and may not be used for any purpose other than to identify prospective properties consumers may be interested in purchasing. Information is deemed reliable but not guaranteed.
- 159 N Burgher Ave
- 245 Bement Ave
- 718 Henderson Ave
- 721-723 Henderson Ave
- 721 Henderson Ave
- 30 Tom Ct
- 30 Winegar Ln
- 303 Davis Ave
- 45 Winegar Ln
- 46 Winegar Ln
- 14 Saint Austins Place
- 16 Bement Ave
- 335 Oakland Ave
- 14 Bement Ave
- 25 South St
- 2 Livingston Ct
- 383 Cary Ave
- 1064 Castleton Ave
- 80 State St
- 56 South St
- 97 Elm St
- 97 Elm St Unit Second Floor Apartment
- 63 Elm St Unit 1
- 287 Pelton Ave
- 350 Cary Ave Unit 1
- 413 Cary Ave Unit 1
- 19 Tompkins Ct
- 360 Broadway
- 530 Castleton Ave Unit 524
- 33 Allen Ct
- 57 Purcell St Unit 2
- 24 Clinton Ave Unit 2
- 47 Arcadia Place
- 10 Broadway Unit 45
- 10 Broadway Unit 45
- 15 Broadway Unit 22
- 140 Silver Lake Rd Unit 140 silver lake rd
- 16 Kelly Pkwy Unit 1
- 72 Broadway Unit 2
- 44 E 4th St Unit 1

Ask me questions while you tour the home.