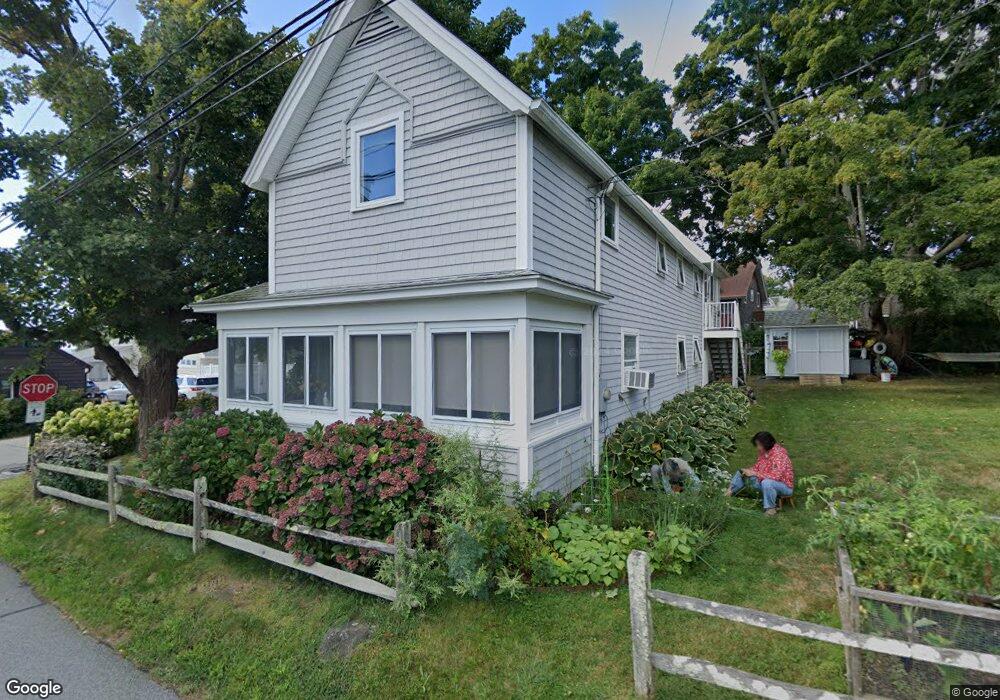
163 Chapman Beach Rd Westbrook, CT 06498
Estimated Value: $491,000 - $756,000
3
Beds
2
Baths
1,134
Sq Ft
$562/Sq Ft
Est. Value
About This Home
This home is located at 163 Chapman Beach Rd, Westbrook, CT 06498 and is currently estimated at $636,860, approximately $561 per square foot. 163 Chapman Beach Rd is a home located in Middlesex County with nearby schools including Daisy Ingraham School, Westbrook Middle School, and Westbrook High School.
Ownership History
Date
Name
Owned For
Owner Type
Purchase Details
Closed on
Oct 15, 2007
Sold by
Saraceno-Vassallo J
Bought by
Picciolo Jeffrey and Liu Yong-Mei
Current Estimated Value
Home Financials for this Owner
Home Financials are based on the most recent Mortgage that was taken out on this home.
Original Mortgage
$225,000
Interest Rate
6.49%
Mortgage Type
Purchase Money Mortgage
Create a Home Valuation Report for This Property
The Home Valuation Report is an in-depth analysis detailing your home's value as well as a comparison with similar homes in the area
Home Values in the Area
Average Home Value in this Area
Purchase History
| Date | Buyer | Sale Price | Title Company |
|---|---|---|---|
| Picciolo Jeffrey | $455,000 | -- |
Source: Public Records
Mortgage History
| Date | Status | Borrower | Loan Amount |
|---|---|---|---|
| Open | Picciolo Jeffrey | $215,000 | |
| Closed | Picciolo Jeffrey | $225,000 |
Source: Public Records
Tax History Compared to Growth
Tax History
| Year | Tax Paid | Tax Assessment Tax Assessment Total Assessment is a certain percentage of the fair market value that is determined by local assessors to be the total taxable value of land and additions on the property. | Land | Improvement |
|---|---|---|---|---|
| 2025 | $3,987 | $177,220 | $112,900 | $64,320 |
| 2024 | $3,846 | $177,220 | $112,900 | $64,320 |
| 2023 | $3,778 | $177,220 | $112,900 | $64,320 |
| 2022 | $3,679 | $177,220 | $112,900 | $64,320 |
| 2021 | $5,664 | $226,560 | $176,400 | $50,160 |
| 2020 | $5,664 | $226,560 | $176,400 | $50,160 |
| 2019 | $5,589 | $226,560 | $176,400 | $50,160 |
| 2018 | $5,521 | $226,560 | $176,400 | $50,160 |
| 2017 | $5,521 | $226,560 | $176,400 | $50,160 |
| 2016 | $5,983 | $258,540 | $203,840 | $54,700 |
| 2015 | $5,820 | $258,540 | $203,840 | $54,700 |
| 2014 | $5,634 | $258,540 | $203,840 | $54,700 |
Source: Public Records
Map
Nearby Homes
- 133 Sandy Point Rd Unit 133
- 143 Sandy Point Rd Unit 143
- 118 Sandy Point Rd
- 254 Hidden Cove Rd
- 19 Sagamore Terrace E
- 83 Sagamore Terrace E
- 96 Chalker Beach Rd
- 17 Woodsedge Ln
- 14 Denmore Ln
- 13 Green Acres Park Dr
- 1 Clark Ave
- 52 Chalker Beach Rd
- 174 Nehantic Trail
- 26 Meadowood Ln
- 12 Allendale Rd
- 78 Hartford Ave
- 122 Old Post Rd
- 1 Hartford Ave
- 1469 Boston Post Rd Unit 19
- 155 Fawn Hill Dr