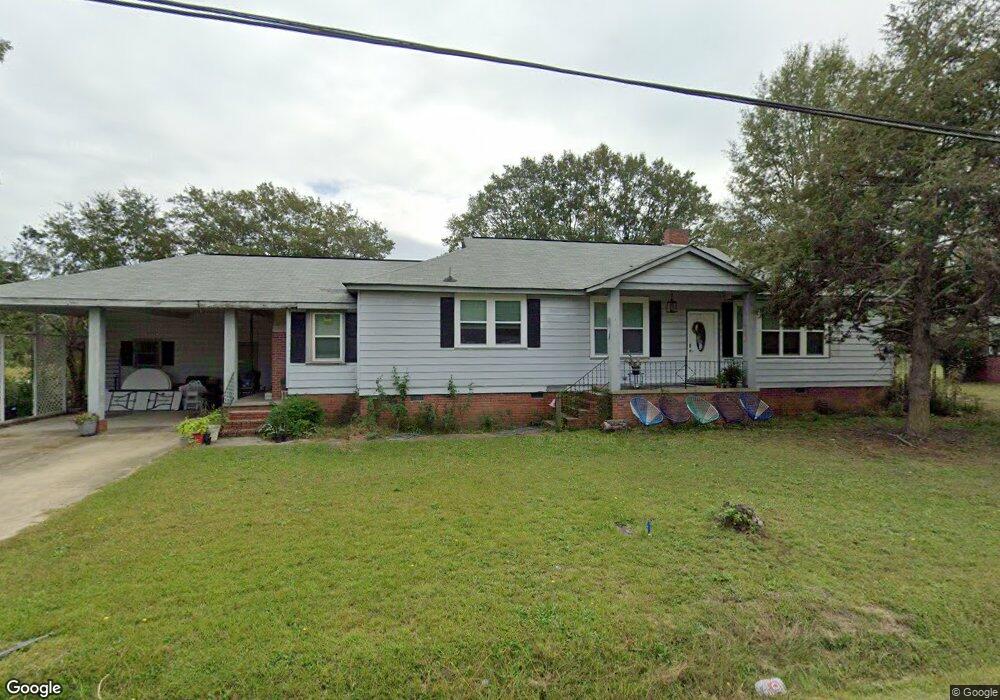
163 Dupont Blvd Lugoff, SC 29078
Estimated Value: $185,000 - $264,000
--
Bed
--
Bath
3,207
Sq Ft
$71/Sq Ft
Est. Value
About This Home
This home is located at 163 Dupont Blvd, Lugoff, SC 29078 and is currently estimated at $226,736, approximately $70 per square foot. 163 Dupont Blvd is a home located in Kershaw County with nearby schools including Lugoff Elementary School, Lugoff-Elgin Middle School, and Lugoff-Elgin High School.
Ownership History
Date
Name
Owned For
Owner Type
Purchase Details
Closed on
Feb 13, 2024
Sold by
Martinez Jose M
Bought by
Martinez Ines Chavez
Current Estimated Value
Purchase Details
Closed on
Feb 9, 2024
Sold by
Boone Elizabeth Ann Mcguirt
Bought by
Martinez Jose M
Purchase Details
Closed on
Jan 30, 2020
Sold by
3B Development Llc
Bought by
Ellis Elizabeth Ann Mcguirt
Purchase Details
Closed on
Nov 5, 2019
Sold by
Mcguirt Ellis Elizabeth Ann
Bought by
3B Development Llc
Home Financials for this Owner
Home Financials are based on the most recent Mortgage that was taken out on this home.
Original Mortgage
$233,147
Interest Rate
3.7%
Mortgage Type
Construction
Purchase Details
Closed on
May 30, 2006
Sold by
Mcguirt J B Est
Bought by
Ellis Elizabeth Ann Mcguirt
Purchase Details
Closed on
Jun 6, 2002
Sold by
Mcguirt J B Est
Bought by
Mcguirt J B Est
Create a Home Valuation Report for This Property
The Home Valuation Report is an in-depth analysis detailing your home's value as well as a comparison with similar homes in the area
Home Values in the Area
Average Home Value in this Area
Purchase History
| Date | Buyer | Sale Price | Title Company |
|---|---|---|---|
| Martinez Ines Chavez | -- | None Listed On Document | |
| Martinez Jose M | $60,000 | None Listed On Document | |
| Ellis Elizabeth Ann Mcguirt | -- | Blair Cato Pickren Casterline | |
| 3B Development Llc | $255,000 | Blair Cato Pickren Casterline | |
| Ellis Elizabeth Ann Mcguirt | -- | -- | |
| Mcguirt J B Est | $10,000 | -- |
Source: Public Records
Mortgage History
| Date | Status | Borrower | Loan Amount |
|---|---|---|---|
| Previous Owner | 3B Development Llc | $233,147 |
Source: Public Records
Tax History Compared to Growth
Tax History
| Year | Tax Paid | Tax Assessment Tax Assessment Total Assessment is a certain percentage of the fair market value that is determined by local assessors to be the total taxable value of land and additions on the property. | Land | Improvement |
|---|---|---|---|---|
| 2025 | $2,736 | $111,500 | $15,000 | $96,500 |
| 2024 | $2,406 | $111,500 | $15,000 | $96,500 |
| 2023 | $671 | $111,500 | $15,000 | $96,500 |
| 2022 | $2,375 | $111,500 | $15,000 | $96,500 |
| 2021 | $2,280 | $111,500 | $15,000 | $96,500 |
| 2020 | $2,042 | $98,700 | $15,000 | $83,700 |
| 2019 | $2,360 | $113,700 | $30,000 | $83,700 |
| 2018 | $2,334 | $113,700 | $30,000 | $83,700 |
| 2017 | $2,309 | $113,700 | $30,000 | $83,700 |
| 2016 | $2,019 | $99,600 | $21,000 | $78,600 |
| 2015 | $1,743 | $99,600 | $21,000 | $78,600 |
| 2014 | $1,743 | $0 | $0 | $0 |
Source: Public Records
Map
Nearby Homes
- 630 Emerson Rd
- 122 Yorkshire Dr
- 594 Hwy#1 S
- 251 Park Dr
- 1276 Champions Rest Rd Unit D
- 1041 Champions Rest Rd Unit D
- 7A Beechnut St
- 149 Willow Creek Blvd Unit 1B
- 56 Ward Rd
- 232 Boulware Rd
- 11 Derby Ln
- 710 Green Pastures Rd
- 157 Wild Turkey Ln
- 1127 Bayview Dr
- 167 Wild Turkey Ln
- 676 Lachicotte Rd
- 90 Truesdell Ave
- 195 Wild Turkey Ln
- 1055 Critzer Dr
- GALEN Plan at Gates Village
- 160 Dupont Blvd
- 155 Dupont Blvd
- 49 Longtown Rd
- 156 Dupont Blvd
- 151 Dupont Blvd
- 154 Dupont Blvd
- 50 Longtown Rd
- 147 Dupont Blvd
- 148 Dupont Blvd
- 670 Highway 1 S
- 111 Branhamwood Rd
- 57 Longtown Rd
- 127 Claytor St
- 143 Dupont Blvd
- 144 Dupont Blvd
- 115 Branhamwood Rd
- 684 Highway 1 S
- 58 Longtown Rd
- 680 Highway 1 S
- 112 Branhamwood Rd