Estimated Value: $392,000 - $462,000
4
Beds
2
Baths
2,200
Sq Ft
$188/Sq Ft
Est. Value
About This Home
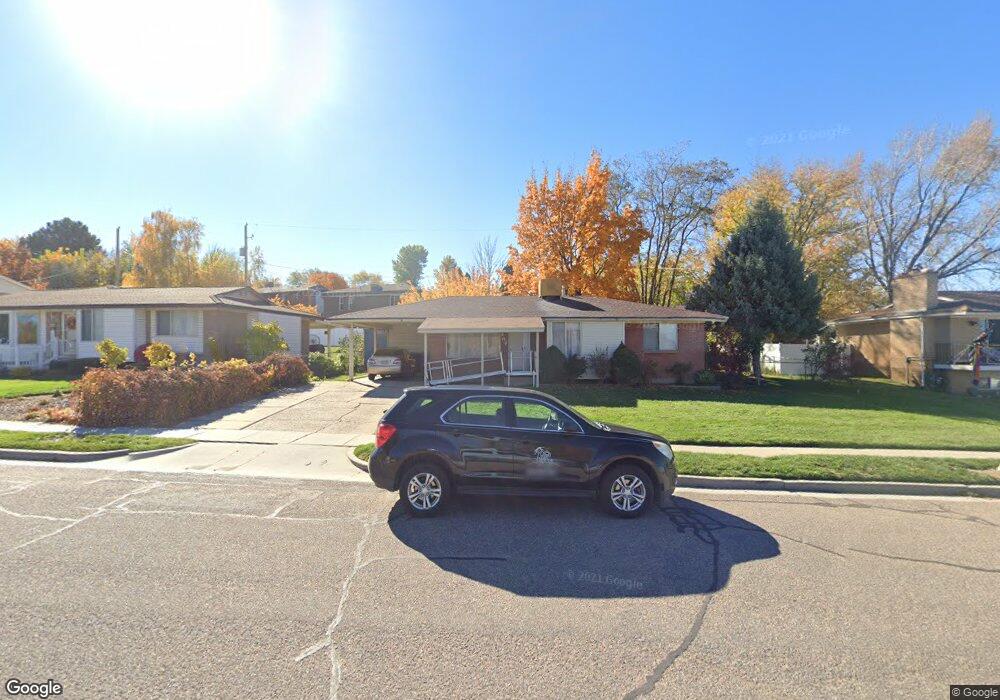
This home is located at 163 E 5200 S, Ogden, UT 84405 and is currently estimated at $412,773, approximately $187 per square foot. 163 E 5200 S is a home located in Weber County with nearby schools including Roosevelt School, T.H. Bell Junior High School, and Bonneville High School.
Ownership History
Date
Name
Owned For
Owner Type
Purchase Details
Closed on
Jul 1, 2024
Sold by
Salas Paula and Salas Paula Correa
Bought by
White Brody and White Myles
Current Estimated Value
Home Financials for this Owner
Home Financials are based on the most recent Mortgage that was taken out on this home.
Original Mortgage
$20,681
Outstanding Balance
$20,435
Interest Rate
7.02%
Estimated Equity
$392,338
Purchase Details
Closed on
Mar 22, 2002
Sold by
Hud
Bought by
Salas Samuel and Salas Paula
Purchase Details
Closed on
Feb 4, 2002
Sold by
Citimortgage Inc
Bought by
Hud
Purchase Details
Closed on
May 29, 2001
Sold by
Perkins John Douglas
Bought by
Citimortgage Inc
Purchase Details
Closed on
Jul 19, 1996
Sold by
Rector John M and Rector Carrie S
Bought by
Perkins John Douglas
Home Financials for this Owner
Home Financials are based on the most recent Mortgage that was taken out on this home.
Original Mortgage
$108,487
Interest Rate
8.3%
Mortgage Type
FHA
Create a Home Valuation Report for This Property
The Home Valuation Report is an in-depth analysis detailing your home's value as well as a comparison with similar homes in the area
Home Values in the Area
Average Home Value in this Area
Purchase History
| Date | Buyer | Sale Price | Title Company |
|---|---|---|---|
| White Brody | -- | Old Republic Title | |
| White Brody | -- | Old Republic Title | |
| Salas Samuel | -- | First American Title | |
| Hud | -- | First Southwestern Title | |
| Hud | -- | First Southwestern Title | |
| Citimortgage Inc | $113,133 | Fidelity National Title Ins | |
| Perkins John Douglas | -- | Equity Title |
Source: Public Records
Mortgage History
| Date | Status | Borrower | Loan Amount |
|---|---|---|---|
| Open | White Brody | $20,681 | |
| Open | White Brody | $378,026 | |
| Previous Owner | Perkins John Douglas | $108,487 |
Source: Public Records
Tax History
| Year | Tax Paid | Tax Assessment Tax Assessment Total Assessment is a certain percentage of the fair market value that is determined by local assessors to be the total taxable value of land and additions on the property. | Land | Improvement |
|---|---|---|---|---|
| 2025 | $2,448 | $379,393 | $131,203 | $248,190 |
| 2024 | $2,335 | $204,049 | $72,161 | $131,888 |
| 2023 | $2,169 | $189,200 | $71,925 | $117,275 |
| 2022 | $2,329 | $210,100 | $69,196 | $140,904 |
| 2021 | $1,813 | $267,000 | $65,662 | $201,338 |
| 2020 | $1,768 | $239,000 | $55,556 | $183,444 |
| 2019 | $1,641 | $207,000 | $50,436 | $156,564 |
| 2018 | $1,442 | $179,000 | $50,436 | $128,564 |
| 2017 | $1,305 | $154,000 | $41,542 | $112,458 |
| 2016 | $1,176 | $76,853 | $20,953 | $55,900 |
| 2015 | $1,092 | $70,204 | $20,953 | $49,251 |
| 2014 | $1,085 | $69,394 | $20,953 | $48,441 |
Source: Public Records
Map
Nearby Homes
Your Personal Tour Guide
Ask me questions while you tour the home.