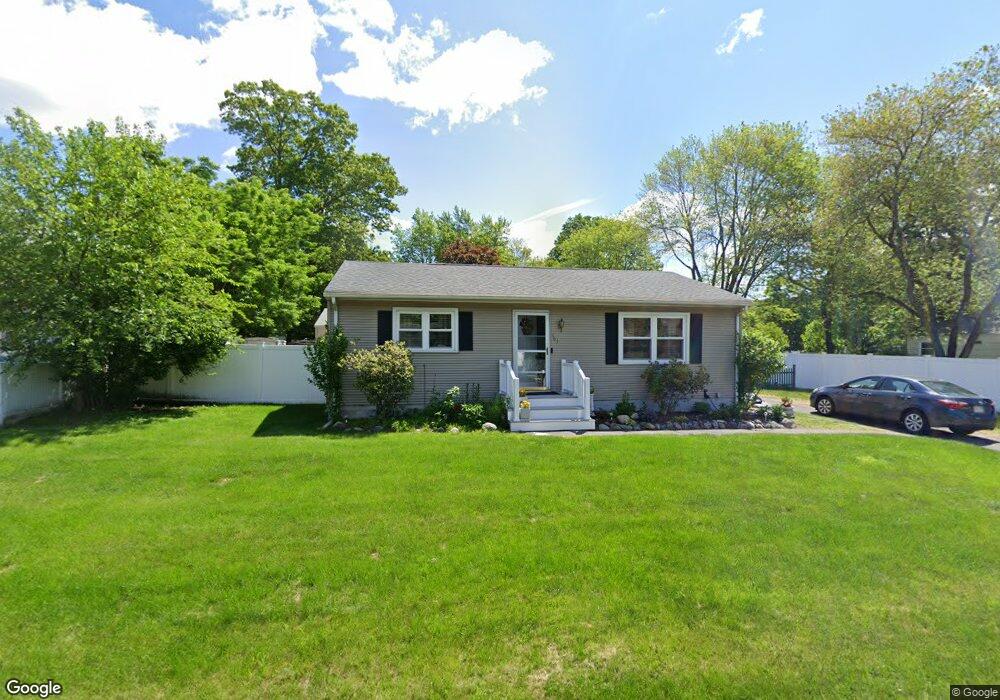
163 Feltham Rd Springfield, MA 01118
Sixteen Acres NeighborhoodEstimated Value: $270,000 - $303,000
2
Beds
2
Baths
999
Sq Ft
$287/Sq Ft
Est. Value
About This Home
This home is located at 163 Feltham Rd, Springfield, MA 01118 and is currently estimated at $286,848, approximately $287 per square foot. 163 Feltham Rd is a home located in Hampden County with nearby schools including Arthur T Talmadge Elementary School, M Marcus Kiley Middle, and Springfield High School of Science and Technology.
Ownership History
Date
Name
Owned For
Owner Type
Purchase Details
Closed on
Oct 16, 2009
Sold by
Weinman Jeffrey J
Bought by
Authors Maxine
Current Estimated Value
Home Financials for this Owner
Home Financials are based on the most recent Mortgage that was taken out on this home.
Original Mortgage
$147,184
Outstanding Balance
$96,403
Interest Rate
5.14%
Mortgage Type
Purchase Money Mortgage
Estimated Equity
$190,445
Purchase Details
Closed on
May 18, 2005
Sold by
Gonzalez Denise E and Maia Denise G
Bought by
Weinman Jeffrey J
Home Financials for this Owner
Home Financials are based on the most recent Mortgage that was taken out on this home.
Original Mortgage
$133,898
Interest Rate
5.95%
Mortgage Type
Purchase Money Mortgage
Create a Home Valuation Report for This Property
The Home Valuation Report is an in-depth analysis detailing your home's value as well as a comparison with similar homes in the area
Home Values in the Area
Average Home Value in this Area
Purchase History
| Date | Buyer | Sale Price | Title Company |
|---|---|---|---|
| Authors Maxine | $149,900 | -- | |
| Weinman Jeffrey J | $13,600 | -- |
Source: Public Records
Mortgage History
| Date | Status | Borrower | Loan Amount |
|---|---|---|---|
| Open | Authors Maxine | $147,184 | |
| Previous Owner | Weinman Jeffrey J | $133,898 |
Source: Public Records
Tax History Compared to Growth
Tax History
| Year | Tax Paid | Tax Assessment Tax Assessment Total Assessment is a certain percentage of the fair market value that is determined by local assessors to be the total taxable value of land and additions on the property. | Land | Improvement |
|---|---|---|---|---|
| 2025 | $3,569 | $227,600 | $56,800 | $170,800 |
| 2024 | $3,469 | $216,000 | $56,800 | $159,200 |
| 2023 | $3,178 | $186,400 | $54,100 | $132,300 |
| 2022 | $3,307 | $175,700 | $54,100 | $121,600 |
| 2021 | $2,748 | $145,400 | $49,200 | $96,200 |
| 2020 | $2,818 | $144,300 | $49,200 | $95,100 |
| 2019 | $2,631 | $133,700 | $49,200 | $84,500 |
| 2018 | $2,633 | $133,800 | $49,200 | $84,600 |
| 2017 | $2,564 | $130,400 | $49,200 | $81,200 |
| 2016 | $2,444 | $124,300 | $49,200 | $75,100 |
| 2015 | $2,378 | $120,900 | $49,200 | $71,700 |
Source: Public Records
Map
Nearby Homes
- 331 Newhouse St
- 41 Hillside Dr
- 41 Kerry Dr
- 82 Louis Rd
- 399 Elm St
- 15 Lynwood Rd
- 86 Talmadge Dr
- 17 Pebble Mill Rd
- 206 Treetop Ave
- 54 Shady Brook Ln
- 19 Westminster St
- 43 Sunridge Dr
- 99 W Crystal Brook Dr
- 55 Allen St
- 125 Manor Ct Unit 125
- 19 Manor Ct Unit 19
- 5 Manor Ct Unit 5
- 157 Canterbury Rd
- 32 Lindsay Rd
- 56 Hadley St