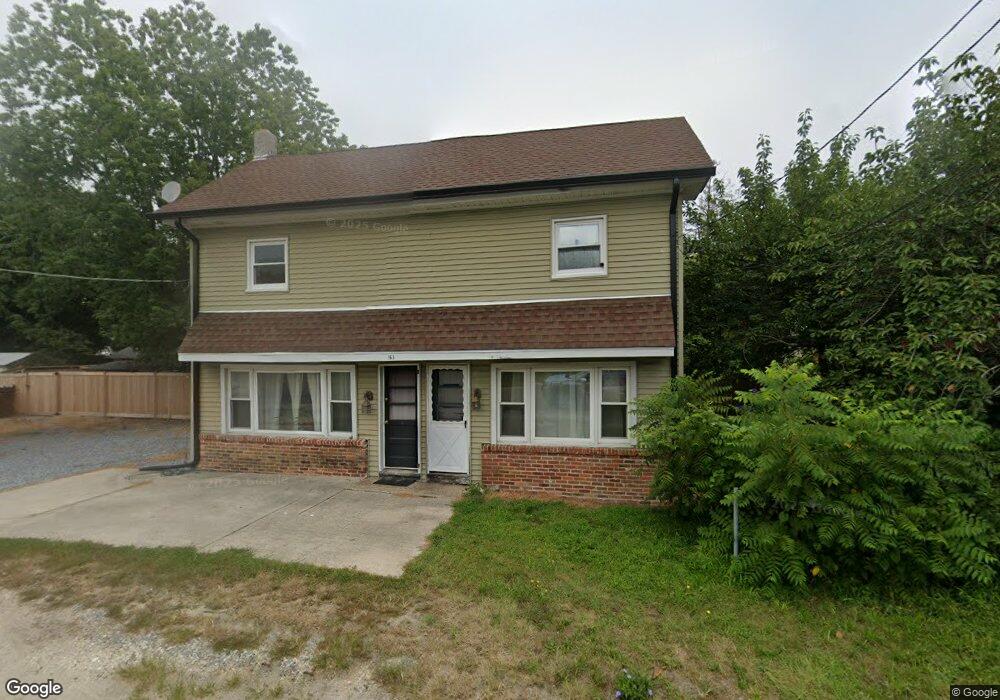
163 High St Leesburg, NJ 08327
Maurice River NeighborhoodEstimated Value: $249,395 - $348,000
--
Bed
--
Bath
2,641
Sq Ft
$109/Sq Ft
Est. Value
About This Home
This home is located at 163 High St, Leesburg, NJ 08327 and is currently estimated at $286,849, approximately $108 per square foot. 163 High St is a home located in Cumberland County with nearby schools including Maurice River Township Elementary School.
Ownership History
Date
Name
Owned For
Owner Type
Purchase Details
Closed on
Feb 15, 2008
Sold by
Slimmer Hershell A 3Rd
Bought by
Slimmer Hershell and Slimmer Amanda
Current Estimated Value
Purchase Details
Closed on
Sep 15, 1999
Sold by
Workman William F
Bought by
Slimmer Hershell A
Home Financials for this Owner
Home Financials are based on the most recent Mortgage that was taken out on this home.
Original Mortgage
$64,900
Outstanding Balance
$19,255
Interest Rate
7.83%
Mortgage Type
FHA
Estimated Equity
$267,594
Create a Home Valuation Report for This Property
The Home Valuation Report is an in-depth analysis detailing your home's value as well as a comparison with similar homes in the area
Home Values in the Area
Average Home Value in this Area
Purchase History
| Date | Buyer | Sale Price | Title Company |
|---|---|---|---|
| Slimmer Hershell | -- | -- | |
| Slimmer Hershell A | $65,000 | -- |
Source: Public Records
Mortgage History
| Date | Status | Borrower | Loan Amount |
|---|---|---|---|
| Open | Slimmer Hershell A | $64,900 |
Source: Public Records
Tax History Compared to Growth
Tax History
| Year | Tax Paid | Tax Assessment Tax Assessment Total Assessment is a certain percentage of the fair market value that is determined by local assessors to be the total taxable value of land and additions on the property. | Land | Improvement |
|---|---|---|---|---|
| 2025 | $5,721 | $197,700 | $31,800 | $165,900 |
| 2024 | $5,721 | $197,700 | $31,800 | $165,900 |
| 2023 | $5,806 | $197,700 | $31,800 | $165,900 |
| 2022 | $5,826 | $197,700 | $31,800 | $165,900 |
| 2021 | $5,708 | $197,700 | $31,800 | $165,900 |
| 2020 | $5,714 | $197,700 | $31,800 | $165,900 |
| 2019 | $5,583 | $197,700 | $31,800 | $165,900 |
| 2018 | $5,451 | $197,700 | $31,800 | $165,900 |
| 2017 | $5,417 | $197,700 | $31,800 | $165,900 |
| 2016 | $5,273 | $197,700 | $31,800 | $165,900 |
| 2015 | $5,227 | $197,700 | $31,800 | $165,900 |
| 2014 | $5,130 | $197,700 | $31,800 | $165,900 |
Source: Public Records
Map
Nearby Homes