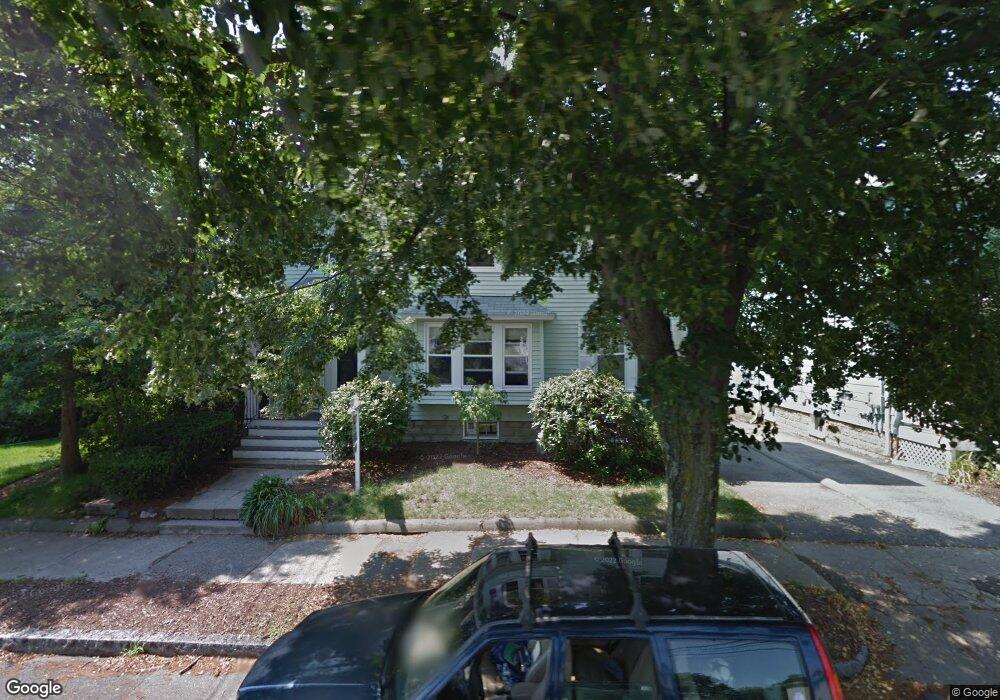
163 Highland Ave Arlington, MA 02476
Arlington Center NeighborhoodEstimated Value: $639,000 - $729,000
5
Beds
2
Baths
2,529
Sq Ft
$267/Sq Ft
Est. Value
About This Home
This home is located at 163 Highland Ave, Arlington, MA 02476 and is currently estimated at $675,553, approximately $267 per square foot. 163 Highland Ave is a home located in Middlesex County with nearby schools including Brackett Elementary School, Ottoson Middle School, and Arlington High School.
Ownership History
Date
Name
Owned For
Owner Type
Purchase Details
Closed on
May 30, 2014
Sold by
Lynch Erick and Zimmerman Stephanie
Bought by
Waldinger Anne C and Mccarthy Maura K
Current Estimated Value
Home Financials for this Owner
Home Financials are based on the most recent Mortgage that was taken out on this home.
Original Mortgage
$311,250
Outstanding Balance
$237,277
Interest Rate
4.26%
Mortgage Type
New Conventional
Estimated Equity
$438,276
Purchase Details
Closed on
Aug 2, 2012
Sold by
Mckenna Stephanie M and Mckenna Kimberley S
Bought by
Lynch Erick and Zimmerman Stephanie
Home Financials for this Owner
Home Financials are based on the most recent Mortgage that was taken out on this home.
Original Mortgage
$362,000
Interest Rate
3.7%
Mortgage Type
New Conventional
Purchase Details
Closed on
Jul 16, 2009
Sold by
Dupont Roger A and Dupont Carla P
Bought by
Mckenna Stephanie M and Sabbag-Mckenna Kimberly E
Home Financials for this Owner
Home Financials are based on the most recent Mortgage that was taken out on this home.
Original Mortgage
$342,950
Interest Rate
5.31%
Mortgage Type
Purchase Money Mortgage
Create a Home Valuation Report for This Property
The Home Valuation Report is an in-depth analysis detailing your home's value as well as a comparison with similar homes in the area
Home Values in the Area
Average Home Value in this Area
Purchase History
| Date | Buyer | Sale Price | Title Company |
|---|---|---|---|
| Waldinger Anne C | $415,000 | -- | |
| Lynch Erick | $382,000 | -- | |
| Mckenna Stephanie M | $361,000 | -- | |
| Mckenna Stephanie M | $361,000 | -- |
Source: Public Records
Mortgage History
| Date | Status | Borrower | Loan Amount |
|---|---|---|---|
| Open | Waldinger Anne C | $311,250 | |
| Previous Owner | Lynch Erick | $362,000 | |
| Previous Owner | Mckenna Stephanie M | $342,950 |
Source: Public Records
Tax History Compared to Growth
Tax History
| Year | Tax Paid | Tax Assessment Tax Assessment Total Assessment is a certain percentage of the fair market value that is determined by local assessors to be the total taxable value of land and additions on the property. | Land | Improvement |
|---|---|---|---|---|
| 2025 | $5,572 | $517,400 | $0 | $517,400 |
| 2024 | $5,335 | $503,800 | $0 | $503,800 |
| 2023 | $5,453 | $486,400 | $0 | $486,400 |
| 2022 | $5,402 | $473,000 | $0 | $473,000 |
| 2021 | $5,213 | $459,700 | $0 | $459,700 |
| 2020 | $5,011 | $453,100 | $0 | $453,100 |
| 2019 | $5,299 | $470,600 | $0 | $470,600 |
| 2018 | $5,063 | $417,400 | $0 | $417,400 |
| 2017 | $4,789 | $381,300 | $0 | $381,300 |
| 2016 | $4,881 | $381,300 | $0 | $381,300 |
| 2015 | $4,786 | $353,200 | $0 | $353,200 |
Source: Public Records
Map
Nearby Homes
- 39 Newport St
- 53 Highland Ave
- 10 Plymouth St Unit 10
- 789 Concord Turnpike
- 37 Fountain Rd Unit 2
- 37 Fountain Rd
- 36 Churchill Ave Unit 1
- 995 Massachusetts Ave Unit 404
- 975 Mass Ave Unit 106
- 204 Plan at Majestic Mill Brook
- 1025 Massachusetts Ave Unit 404
- 1025 Massachusetts Ave Unit 506
- 1025 Massachusetts Ave Unit 401
- 1025 Massachusetts Ave Unit 210
- 1025 Massachusetts Ave Unit 402
- 1025 Massachusetts Ave Unit 308
- 1025 Massachusetts Ave Unit 411
- 1025 Massachusetts Ave Unit 313
- 1025 Massachusetts Ave Unit 304
- 1025 Massachusetts Ave Unit 414
- 163 Highland Ave Unit 1
- 163 Highland Ave Unit 165
- 167 Highland Ave
- 161 Highland Ave
- 159 Highland Ave
- 171 Highland Ave
- 155 Highland Ave
- 178 Highland Ave
- 172 Highland Ave
- 118 Newport St
- 114 Newport St
- 122 Newport St
- 166 Highland Ave Unit 168
- 157 Highland Ave
- 168 Highland Ave Unit 168
- 168 Highland Ave Unit 1
- 110 Newport St
- 151-153 Highland Ave Unit 2
- 151-153 Highland Ave
- 126 Newport St