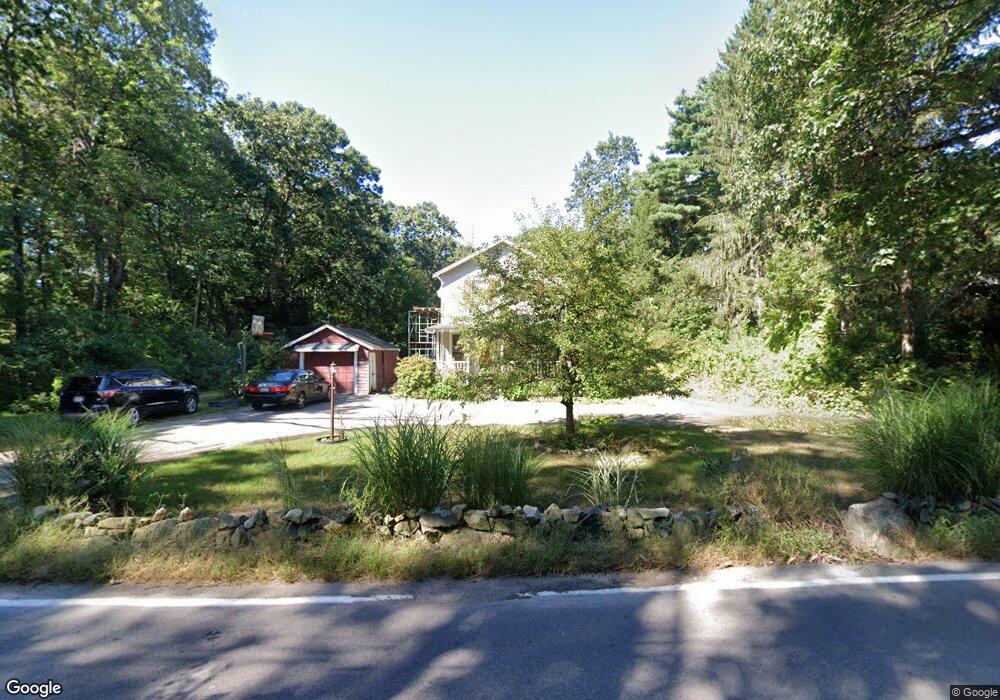
163 Holliston St Medway, MA 02053
Estimated Value: $701,060 - $786,000
4
Beds
3
Baths
2,280
Sq Ft
$320/Sq Ft
Est. Value
About This Home
This home is located at 163 Holliston St, Medway, MA 02053 and is currently estimated at $728,765, approximately $319 per square foot. 163 Holliston St is a home located in Norfolk County with nearby schools including John D. McGovern Elementary School, Burke-Memorial Elementary, and Medway Middle School.
Ownership History
Date
Name
Owned For
Owner Type
Purchase Details
Closed on
Oct 31, 1996
Sold by
Wengfeld Robert A and Wengfeld Nancy M
Bought by
Johnson David W
Current Estimated Value
Home Financials for this Owner
Home Financials are based on the most recent Mortgage that was taken out on this home.
Original Mortgage
$117,000
Interest Rate
8.07%
Mortgage Type
Purchase Money Mortgage
Create a Home Valuation Report for This Property
The Home Valuation Report is an in-depth analysis detailing your home's value as well as a comparison with similar homes in the area
Home Values in the Area
Average Home Value in this Area
Purchase History
| Date | Buyer | Sale Price | Title Company |
|---|---|---|---|
| Johnson David W | $147,000 | -- |
Source: Public Records
Mortgage History
| Date | Status | Borrower | Loan Amount |
|---|---|---|---|
| Open | Johnson David W | $250,000 | |
| Closed | Johnson David W | $118,300 | |
| Closed | Johnson David W | $117,000 | |
| Previous Owner | Johnson David W | $45,000 |
Source: Public Records
Tax History Compared to Growth
Tax History
| Year | Tax Paid | Tax Assessment Tax Assessment Total Assessment is a certain percentage of the fair market value that is determined by local assessors to be the total taxable value of land and additions on the property. | Land | Improvement |
|---|---|---|---|---|
| 2025 | $7,709 | $541,000 | $272,400 | $268,600 |
| 2024 | $7,790 | $541,000 | $272,400 | $268,600 |
| 2023 | $7,713 | $483,900 | $234,700 | $249,200 |
| 2022 | $7,470 | $441,200 | $209,500 | $231,700 |
| 2021 | $7,379 | $422,600 | $188,600 | $234,000 |
| 2020 | $7,014 | $400,800 | $167,600 | $233,200 |
| 2019 | $6,700 | $394,800 | $167,600 | $227,200 |
| 2018 | $6,744 | $381,900 | $146,700 | $235,200 |
| 2017 | $6,655 | $371,400 | $136,200 | $235,200 |
| 2016 | $6,563 | $362,400 | $131,200 | $231,200 |
| 2015 | $5,560 | $304,800 | $123,600 | $181,200 |
| 2014 | $5,388 | $286,000 | $120,800 | $165,200 |
Source: Public Records
Map
Nearby Homes
- 30 Broken Tree Rd
- 1 Walnut Ln
- 19 Sycamore Way Unit L40
- 0 Hill St
- 116 Winthrop St
- 7 Hill St
- 625 Norfolk St
- 140 Goulding St
- 36 Lovering St
- 106 Holliston St
- 12 Lovering St
- 1 Jameson Dr Unit 1
- 3 Jameson Dr Unit 3
- 3 Meryl St
- 14 Heritage Dr
- 73 Orchard St
- 266 Willowgate Rise
- 22 Sunset Dr
- 27 Richardson Dr Unit 27
- 50 Main St
- 165 Holliston St
- 2 Woodland Rd
- 167 Holliston St
- 4 Woodland Rd
- 6 Woodland Rd
- 1 Woodland Rd
- 171 Holliston St
- 8 Woodland Rd
- 158 Holliston St
- 7 Fairway Ln
- 155 Holliston St
- 166R Holliston St
- 2 Fairway Ln
- 10 Woodland Rd
- 170 Holliston St
- 5 Woodland Rd
- 4 Fairway Ln
- 166 Holliston St
- 166 Holliston St
- 3 Wingate Farm Rd