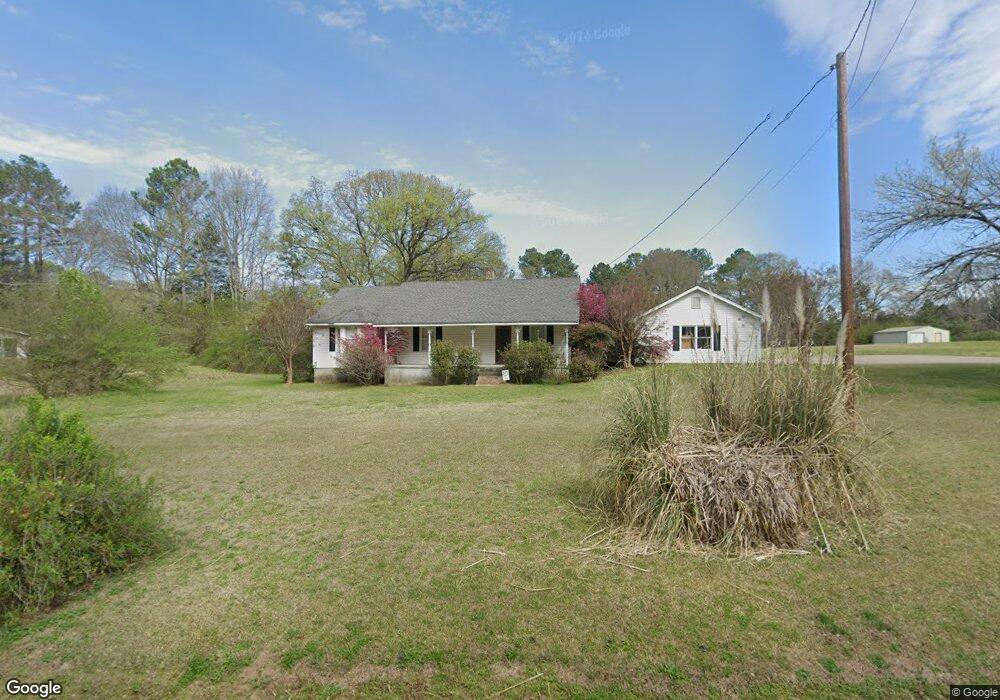
163 Lovvorn Rd Cedartown, GA 30125
Estimated Value: $203,000 - $241,000
3
Beds
1
Bath
1,554
Sq Ft
$141/Sq Ft
Est. Value
About This Home
This home is located at 163 Lovvorn Rd, Cedartown, GA 30125 and is currently estimated at $218,868, approximately $140 per square foot. 163 Lovvorn Rd is a home located in Polk County with nearby schools including Cedar Christian School.
Ownership History
Date
Name
Owned For
Owner Type
Purchase Details
Closed on
Jun 1, 2005
Sold by
Cates Susan
Bought by
Cates Wayne Douglas and Cates Susan Ray
Current Estimated Value
Purchase Details
Closed on
May 27, 2005
Sold by
Ray Martha Jo
Bought by
Cates Susan R
Purchase Details
Closed on
Nov 7, 1995
Sold by
Cates Susan
Bought by
Cates Susan and Martha Jo Ray
Purchase Details
Closed on
Mar 14, 1995
Sold by
Ray Martha Jo
Bought by
Cates Susan R
Purchase Details
Closed on
Nov 11, 1963
Sold by
Coleman Earl
Bought by
Ray Martha Jo
Purchase Details
Closed on
Mar 12, 1955
Bought by
Coleman Earl
Create a Home Valuation Report for This Property
The Home Valuation Report is an in-depth analysis detailing your home's value as well as a comparison with similar homes in the area
Home Values in the Area
Average Home Value in this Area
Purchase History
| Date | Buyer | Sale Price | Title Company |
|---|---|---|---|
| Cates Wayne Douglas | -- | -- | |
| Cates Susan R | -- | -- | |
| Cates Susan | -- | -- | |
| Cates Susan R | -- | -- | |
| Ray Martha Jo | -- | -- | |
| Coleman Earl | -- | -- |
Source: Public Records
Tax History Compared to Growth
Tax History
| Year | Tax Paid | Tax Assessment Tax Assessment Total Assessment is a certain percentage of the fair market value that is determined by local assessors to be the total taxable value of land and additions on the property. | Land | Improvement |
|---|---|---|---|---|
| 2024 | $1,457 | $69,718 | $5,630 | $64,088 |
| 2023 | $1,126 | $47,446 | $5,630 | $41,816 |
| 2022 | $950 | $40,026 | $3,754 | $36,272 |
| 2021 | $962 | $40,026 | $3,754 | $36,272 |
| 2020 | $964 | $40,026 | $3,754 | $36,272 |
| 2019 | $677 | $25,226 | $3,754 | $21,472 |
| 2018 | $657 | $23,833 | $3,754 | $20,079 |
| 2017 | $649 | $23,833 | $3,754 | $20,079 |
| 2016 | $731 | $26,850 | $6,772 | $20,079 |
| 2015 | $738 | $27,040 | $6,772 | $20,268 |
| 2014 | $743 | $27,040 | $6,772 | $20,268 |
Source: Public Records
Map
Nearby Homes
- 480 Cason Rd
- 766 Antioch Rd
- 203 Cason Rd
- 35 Old Mill Rd
- 255 Mildred Dr
- 117 Cason Rd
- 205 Pinecrest Rd
- 1987 Buchanan Hwy
- 00 Buchanan Hwy
- 95 Wieuca Way
- 240 Benedict Loop
- 0 Coaling Rd Unit 9221-D 10352096
- 0 Coaling Rd Unit 9221-C 10352086
- 0 Coaling Rd Unit 9221 10352063
- 0 Coaling Rd Unit 9221-B 10352079
- 0 Philpot Springs Unit 10626665
- 149 Irwin St
- 142 Acres On Judkin Mill Rd
- 000 Wieuca Way
- 0 Wieuca Way Unit 10614129
- 151 Lovvorn Rd
- 120 Walker Way
- 120 Walker Way
- 191 Lovvorn Rd
- 150 Lovvorn Rd
- 140 Lovvorn Rd
- 117 Walker Way
- 130 Lovvorn Rd
- 107 Walker Way
- 98 Walker Way
- 97 Walker Way
- 97 Walker Way Unit Acres
- 97 Walker Way Unit 11
- 86 Walker Way
- 210 Lovvorn Rd
- 85 Walker Way
- 72 Walker Way
- 71 Walker Way
- 114 Lovvorn Rd
- 85 Lovvorn Rd