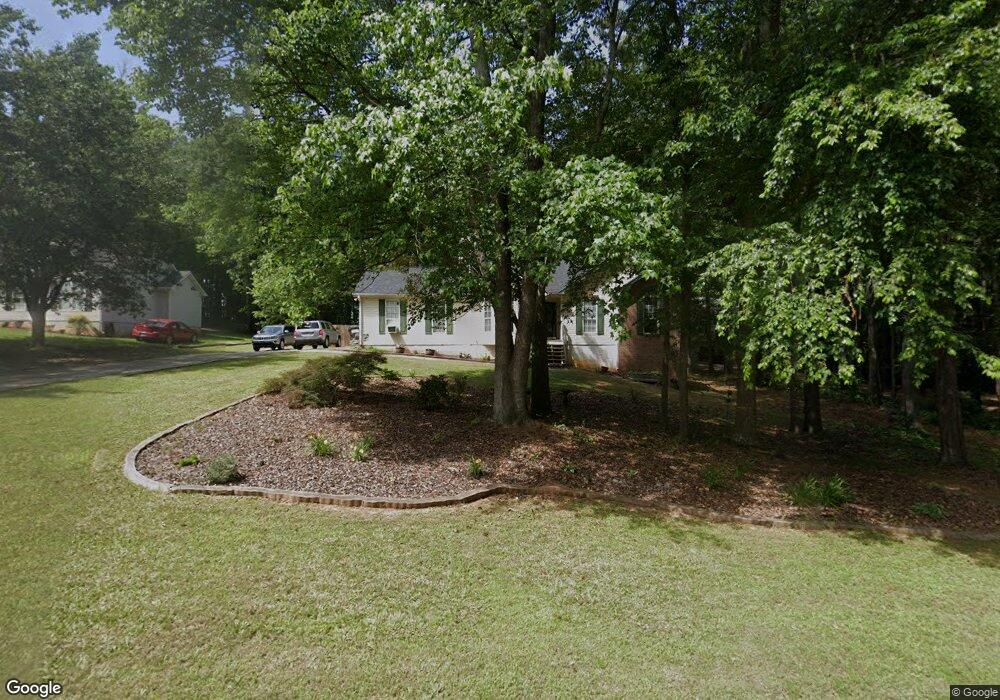
163 Marsha Way Sharpsburg, GA 30277
Estimated Value: $306,000 - $324,000
3
Beds
2
Baths
1,390
Sq Ft
$227/Sq Ft
Est. Value
About This Home
This home is located at 163 Marsha Way, Sharpsburg, GA 30277 and is currently estimated at $315,958, approximately $227 per square foot. 163 Marsha Way is a home located in Coweta County with nearby schools including Poplar Road Elementary School, East Coweta Middle School, and East Coweta High School.
Ownership History
Date
Name
Owned For
Owner Type
Purchase Details
Closed on
Aug 31, 2011
Sold by
Jones James Michael
Bought by
Jerome Samantha D
Current Estimated Value
Home Financials for this Owner
Home Financials are based on the most recent Mortgage that was taken out on this home.
Original Mortgage
$114,950
Outstanding Balance
$78,956
Interest Rate
4.4%
Mortgage Type
New Conventional
Estimated Equity
$237,002
Purchase Details
Closed on
Oct 18, 1994
Sold by
Lindsey Homes
Bought by
Jones James P and Jones Sarah L
Home Financials for this Owner
Home Financials are based on the most recent Mortgage that was taken out on this home.
Original Mortgage
$102,000
Interest Rate
8.5%
Mortgage Type
VA
Purchase Details
Closed on
Aug 25, 1994
Bought by
David Lindsey Homes
Home Financials for this Owner
Home Financials are based on the most recent Mortgage that was taken out on this home.
Original Mortgage
$102,000
Interest Rate
8.5%
Mortgage Type
VA
Purchase Details
Closed on
May 27, 1993
Bought by
Reese Builders & Dev
Create a Home Valuation Report for This Property
The Home Valuation Report is an in-depth analysis detailing your home's value as well as a comparison with similar homes in the area
Home Values in the Area
Average Home Value in this Area
Purchase History
| Date | Buyer | Sale Price | Title Company |
|---|---|---|---|
| Jerome Samantha D | $121,000 | -- | |
| Jones James P | $100,000 | -- | |
| David Lindsey Homes | $72,500 | -- | |
| Reese Builders & Dev | $480,100 | -- |
Source: Public Records
Mortgage History
| Date | Status | Borrower | Loan Amount |
|---|---|---|---|
| Open | Jerome Samantha D | $114,950 | |
| Previous Owner | Jones James P | $102,000 |
Source: Public Records
Tax History Compared to Growth
Tax History
| Year | Tax Paid | Tax Assessment Tax Assessment Total Assessment is a certain percentage of the fair market value that is determined by local assessors to be the total taxable value of land and additions on the property. | Land | Improvement |
|---|---|---|---|---|
| 2025 | $2,427 | $110,361 | $26,000 | $84,361 |
| 2024 | $2,274 | $102,540 | $26,000 | $76,540 |
| 2023 | $2,274 | $107,462 | $24,000 | $83,462 |
| 2022 | $2,007 | $86,192 | $20,000 | $66,192 |
| 2021 | $1,764 | $71,697 | $16,000 | $55,697 |
| 2020 | $1,775 | $71,697 | $16,000 | $55,697 |
| 2019 | $1,789 | $65,912 | $10,000 | $55,912 |
| 2018 | $1,792 | $65,912 | $10,000 | $55,912 |
| 2017 | $1,610 | $59,700 | $10,000 | $49,700 |
| 2016 | $1,593 | $59,700 | $10,000 | $49,700 |
| 2015 | $1,391 | $53,487 | $10,000 | $43,487 |
| 2014 | $1,207 | $47,274 | $10,000 | $37,274 |
Source: Public Records
Map
Nearby Homes
- 140 Halo Trace
- 138 Main St
- 1 Mcintosh Trail
- 0 Bob Smith Rd Unit 10562838
- 196 Bob Smith Rd
- 250 Bob Smith Rd
- 180 Saint James Place
- 0 Highway 154 Unit 10470800
- 68 Winchester Dr
- 46 Lullwater Ct
- 25 Chemin Place
- 25 Lentry Dr
- 296 Mcintosh Trail
- 565 Timberbrook Dr
- 28 Fawn Ct
- 8 Chiefs Trail
- 316 Winchester Dr
- 270 Sturgess Run
- 483 Mcintosh Trail
- 49 Durham Estates Dr
- 155 Marsha Way
- 155 Marsha Way
- 155 Marsha Way Unit 155
- 169 Marsha Way
- 145 Marsha Way
- 150 Marsha Way
- 162 Marsha Way
- 171 Marsha Way
- 184 Marsha Way
- 136 Marsha Way
- 123 Marsha Way
- 185 Marsha Way
- 1933 Marsha Way
- 51 Jeanette Ct
- 200 Marsha Way
- 124 Marsha Way
- 53 Jeanette Ct
- 193 Marsha Way
- 117 Marsha Way
- 220 Marsha Way