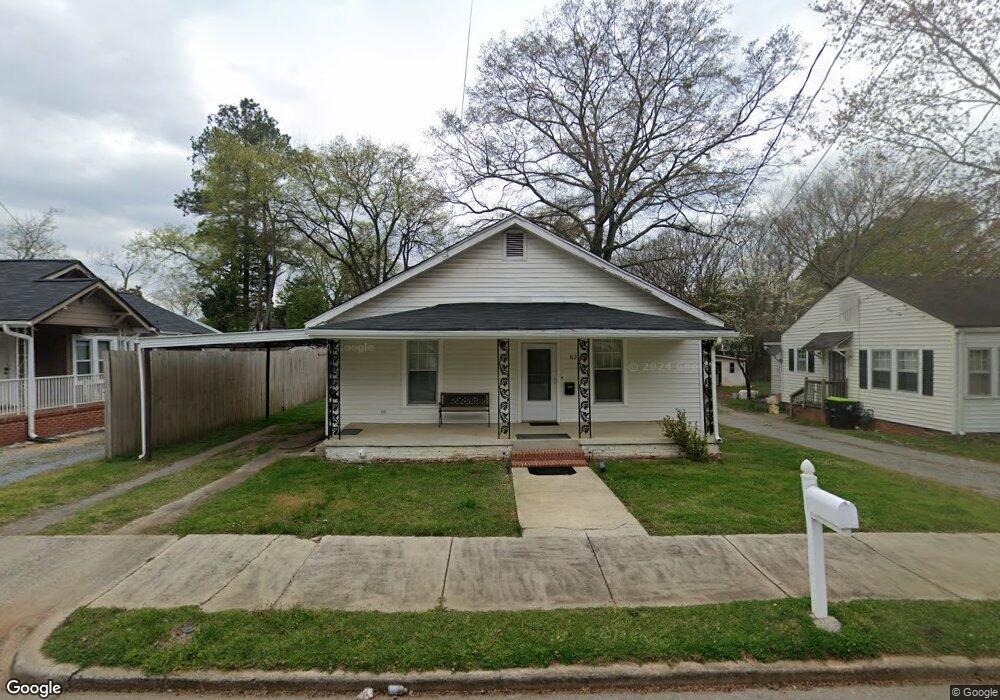
163 Marshall St Cedartown, GA 30125
Estimated Value: $153,000 - $216,000
2
Beds
3
Baths
1,574
Sq Ft
$112/Sq Ft
Est. Value
About This Home
This home is located at 163 Marshall St, Cedartown, GA 30125 and is currently estimated at $176,074, approximately $111 per square foot. 163 Marshall St is a home located in Polk County with nearby schools including Cedar Christian School and Vineyard Harvester Christian Academy.
Ownership History
Date
Name
Owned For
Owner Type
Purchase Details
Closed on
Jun 12, 2020
Sold by
Stroup Ruth O Estate
Bought by
Bartolo Abelino Lucas
Current Estimated Value
Purchase Details
Closed on
Jun 29, 1994
Sold by
Carter Paul L Executor
Bought by
Stroup Ruth O
Purchase Details
Closed on
Sep 10, 1979
Sold by
Turner Horace F
Bought by
Carter James J
Purchase Details
Closed on
Apr 30, 1979
Sold by
Lundy William L
Bought by
Turner Horace F
Purchase Details
Closed on
Feb 22, 1979
Sold by
Teat John N
Bought by
Lundy William L
Purchase Details
Closed on
Feb 12, 1979
Sold by
Beck Dual
Bought by
Teat John N
Purchase Details
Closed on
Oct 27, 1978
Sold by
Grey Ethel F
Bought by
Beck Dual
Purchase Details
Closed on
Jan 9, 1974
Sold by
Hammill Pearl
Bought by
Grey Ethel F
Purchase Details
Closed on
Jan 1, 1902
Sold by
Hammell Mrs C R
Bought by
Hammill Pearl
Purchase Details
Closed on
Jan 1, 1901
Bought by
Hammell Mrs C R
Create a Home Valuation Report for This Property
The Home Valuation Report is an in-depth analysis detailing your home's value as well as a comparison with similar homes in the area
Home Values in the Area
Average Home Value in this Area
Purchase History
| Date | Buyer | Sale Price | Title Company |
|---|---|---|---|
| Bartolo Abelino Lucas | $45,000 | -- | |
| Stroup Ruth O | $30,000 | -- | |
| Carter James J | -- | -- | |
| Turner Horace F | -- | -- | |
| Lundy William L | -- | -- | |
| Teat John N | -- | -- | |
| Beck Dual | -- | -- | |
| Grey Ethel F | -- | -- | |
| Hammill Pearl | -- | -- | |
| Hammell Mrs C R | -- | -- |
Source: Public Records
Tax History Compared to Growth
Tax History
| Year | Tax Paid | Tax Assessment Tax Assessment Total Assessment is a certain percentage of the fair market value that is determined by local assessors to be the total taxable value of land and additions on the property. | Land | Improvement |
|---|---|---|---|---|
| 2024 | $1,483 | $46,950 | $2,880 | $44,070 |
| 2023 | $670 | $19,334 | $2,880 | $16,454 |
| 2022 | $406 | $17,114 | $2,880 | $14,234 |
| 2021 | $411 | $17,114 | $2,880 | $14,234 |
| 2020 | $130 | $17,114 | $2,880 | $14,234 |
| 2019 | $148 | $17,192 | $2,593 | $14,599 |
| 2018 | $146 | $16,736 | $2,593 | $14,143 |
| 2017 | $141 | $16,736 | $2,593 | $14,143 |
| 2016 | $141 | $16,736 | $2,593 | $14,143 |
| 2015 | $100 | $13,006 | $2,593 | $10,413 |
| 2014 | $100 | $13,006 | $2,593 | $10,413 |
Source: Public Records
Map
Nearby Homes
- 214 Victoria Ave
- 144 Marshall St
- 228 Marshall St
- 408 N College St
- 328 Mountain Home Rd
- 601 Mountain Home Rd
- 305 N Cave Spring St
- 258 Chestnut St
- 421 Wissahickon Ave
- 607 N College St
- 309 Walnut St
- 208 Highland Ave
- 605 W Girard Ave
- 443 N Cave Spring St
- 422 Walnut St
- 214 Jule Peek Ave
- 328 330 Stubbs
- 254 E Girard Ave
- 217 E Gibson St
- 403 Lakeside Dr
- 165 Marshall St
- 161 Marshall St
- 167 Marshall St
- 159 Marshall St
- 168 N College St
- 166 N College St
- 153 Marshall St
- 202 N College St
- 156 Marshall St
- 201 Marshall St
- 162 Marshall St
- 160 N College St
- 168 Marshall St
- 152 Marshall St
- 202 Marshall St
- 147 Marshall St
- 300 N College St
- 205 Marshall St
- 148 Marshall St
- 302 N College St