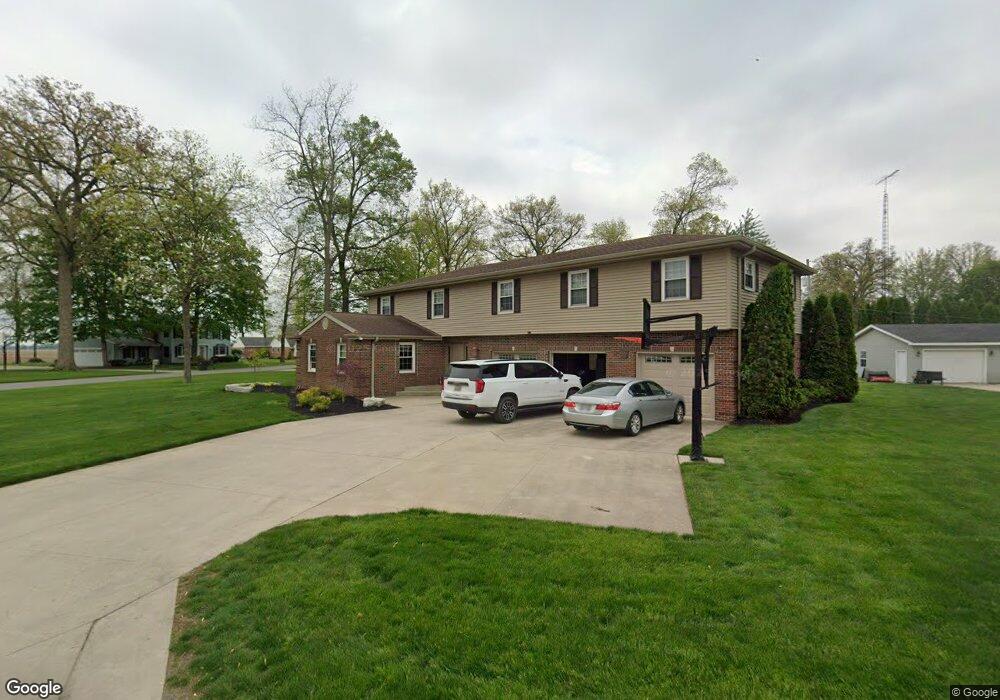
163 Michele Dr Delphos, OH 45833
Estimated Value: $327,480 - $368,000
4
Beds
3
Baths
3,422
Sq Ft
$100/Sq Ft
Est. Value
About This Home
This home is located at 163 Michele Dr, Delphos, OH 45833 and is currently estimated at $343,370, approximately $100 per square foot. 163 Michele Dr is a home located in Allen County with nearby schools including Delphos St. John's High School and Delphos St. John's Elementary School.
Ownership History
Date
Name
Owned For
Owner Type
Purchase Details
Closed on
Nov 22, 2021
Sold by
Warnecke James L and Warnecke Suzanne M
Bought by
Eppley Erin E and Grubenhoff Michael
Current Estimated Value
Home Financials for this Owner
Home Financials are based on the most recent Mortgage that was taken out on this home.
Original Mortgage
$333,841
Outstanding Balance
$306,162
Interest Rate
3.05%
Mortgage Type
FHA
Estimated Equity
$37,208
Purchase Details
Closed on
Nov 16, 2012
Sold by
Warnecke James L
Bought by
Warnecke Suzanne M
Purchase Details
Closed on
Jun 10, 1994
Sold by
Kopilchack John
Bought by
Warnecke James and Warnecke Suzanne
Home Financials for this Owner
Home Financials are based on the most recent Mortgage that was taken out on this home.
Original Mortgage
$81,728
Interest Rate
7%
Mortgage Type
New Conventional
Purchase Details
Closed on
Oct 1, 1987
Bought by
Kopilchack John A
Create a Home Valuation Report for This Property
The Home Valuation Report is an in-depth analysis detailing your home's value as well as a comparison with similar homes in the area
Home Values in the Area
Average Home Value in this Area
Purchase History
| Date | Buyer | Sale Price | Title Company |
|---|---|---|---|
| Eppley Erin E | -- | None Available | |
| Warnecke Suzanne M | -- | None Available | |
| Warnecke James | $105,000 | -- | |
| Kopilchack John A | $94,500 | -- |
Source: Public Records
Mortgage History
| Date | Status | Borrower | Loan Amount |
|---|---|---|---|
| Open | Eppley Erin E | $333,841 | |
| Closed | Warnecke James | $81,728 |
Source: Public Records
Tax History Compared to Growth
Tax History
| Year | Tax Paid | Tax Assessment Tax Assessment Total Assessment is a certain percentage of the fair market value that is determined by local assessors to be the total taxable value of land and additions on the property. | Land | Improvement |
|---|---|---|---|---|
| 2024 | $2,962 | $95,940 | $13,020 | $82,920 |
| 2023 | $2,651 | $79,940 | $10,850 | $69,090 |
| 2022 | $2,642 | $79,940 | $10,850 | $69,090 |
| 2021 | $2,645 | $79,940 | $10,850 | $69,090 |
| 2020 | $2,075 | $64,650 | $10,260 | $54,390 |
| 2019 | $2,075 | $64,650 | $10,260 | $54,390 |
| 2018 | $2,082 | $64,650 | $10,260 | $54,390 |
| 2017 | $2,094 | $64,650 | $10,260 | $54,390 |
| 2016 | $2,088 | $64,650 | $10,260 | $54,390 |
| 2015 | $2,228 | $64,650 | $10,260 | $54,390 |
| 2014 | $2,228 | $68,040 | $9,450 | $58,590 |
| 2013 | $2,227 | $68,040 | $9,450 | $58,590 |
Source: Public Records
Map
Nearby Homes
- 7110 Elida Rd
- 914 E 3rd St
- 903 E 3rd St
- 821 E 3rd St
- 633 E 2nd St
- 650 E 6th St
- 1220 Rose Anna Dr
- 1303 Carolyn Dr
- 628 N Pierce St
- 405 N Franklin St
- 1001 S Adams St
- 210 E 3rd St
- 704 N Franklin St
- 508 S Washington St
- 810 N Franklin St
- 610 N Washington St
- 221 S Main St
- 827 S Washington St
- 424 S Canal St
- 634 S Clay St