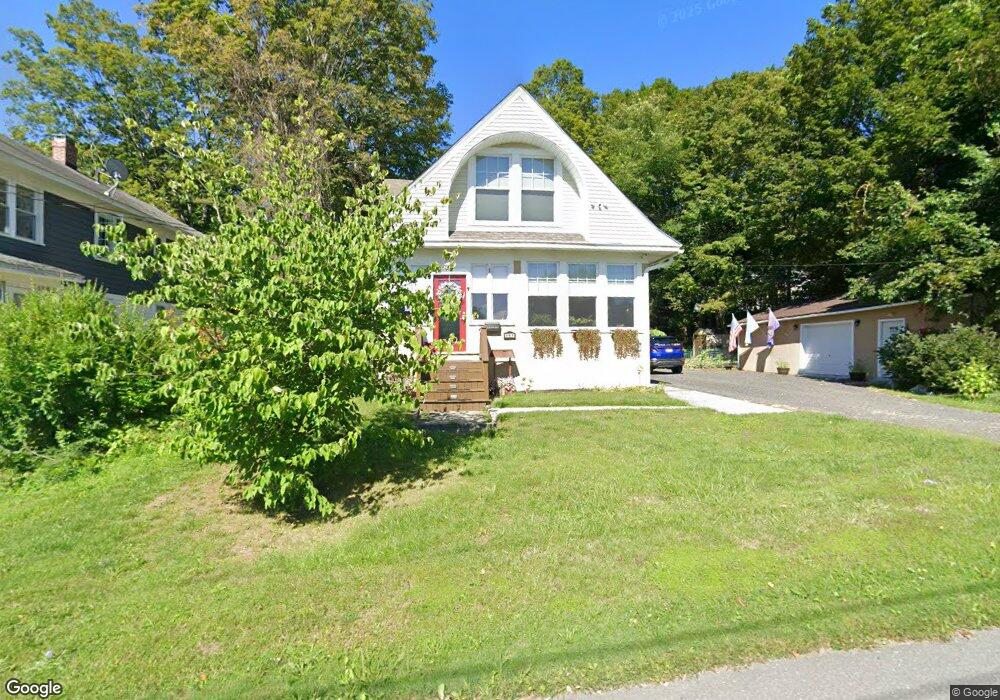
163 Mohegan St Pittsfield, MA 01201
Estimated Value: $215,328 - $240,000
4
Beds
2
Baths
1,675
Sq Ft
$138/Sq Ft
Est. Value
About This Home
This home is located at 163 Mohegan St, Pittsfield, MA 01201 and is currently estimated at $231,832, approximately $138 per square foot. 163 Mohegan St is a home located in Berkshire County.
Ownership History
Date
Name
Owned For
Owner Type
Purchase Details
Closed on
Oct 28, 2022
Sold by
Trzcinka Robert F
Bought by
Trzcinka Maria K
Current Estimated Value
Home Financials for this Owner
Home Financials are based on the most recent Mortgage that was taken out on this home.
Original Mortgage
$180,000
Interest Rate
5%
Mortgage Type
Adjustable Rate Mortgage/ARM
Purchase Details
Closed on
Oct 26, 2012
Sold by
Monti Ettore J and Monti Patricia A
Bought by
Trzcinka Robert F
Home Financials for this Owner
Home Financials are based on the most recent Mortgage that was taken out on this home.
Original Mortgage
$82,400
Interest Rate
3.56%
Mortgage Type
New Conventional
Create a Home Valuation Report for This Property
The Home Valuation Report is an in-depth analysis detailing your home's value as well as a comparison with similar homes in the area
Home Values in the Area
Average Home Value in this Area
Purchase History
| Date | Buyer | Sale Price | Title Company |
|---|---|---|---|
| Trzcinka Maria K | -- | None Available | |
| Trzcinka Maria K | -- | None Available | |
| Trzcinka Maria K | -- | None Available | |
| Trzcinka Robert F | $103,000 | -- |
Source: Public Records
Mortgage History
| Date | Status | Borrower | Loan Amount |
|---|---|---|---|
| Previous Owner | Trzcinka Maria K | $180,000 | |
| Previous Owner | Trzcinka Robert F | $82,400 |
Source: Public Records
Tax History Compared to Growth
Tax History
| Year | Tax Paid | Tax Assessment Tax Assessment Total Assessment is a certain percentage of the fair market value that is determined by local assessors to be the total taxable value of land and additions on the property. | Land | Improvement |
|---|---|---|---|---|
| 2025 | $3,620 | $201,800 | $54,000 | $147,800 |
| 2024 | $3,640 | $197,300 | $54,000 | $143,300 |
| 2023 | $3,380 | $184,500 | $54,000 | $130,500 |
| 2022 | $2,606 | $140,400 | $27,000 | $113,400 |
| 2021 | $2,391 | $124,200 | $27,000 | $97,200 |
| 2020 | $2,290 | $116,200 | $22,100 | $94,100 |
| 2019 | $2,132 | $109,800 | $23,900 | $85,900 |
| 2018 | $2,037 | $106,700 | $23,900 | $82,800 |
| 2017 | $2,059 | $104,900 | $25,200 | $79,700 |
| 2016 | $2,146 | $114,400 | $34,200 | $80,200 |
| 2015 | $2,066 | $114,400 | $34,200 | $80,200 |
Source: Public Records
Map
Nearby Homes