Estimated Value: $281,188 - $317,000
3
Beds
2
Baths
1,268
Sq Ft
$239/Sq Ft
Est. Value
About This Home
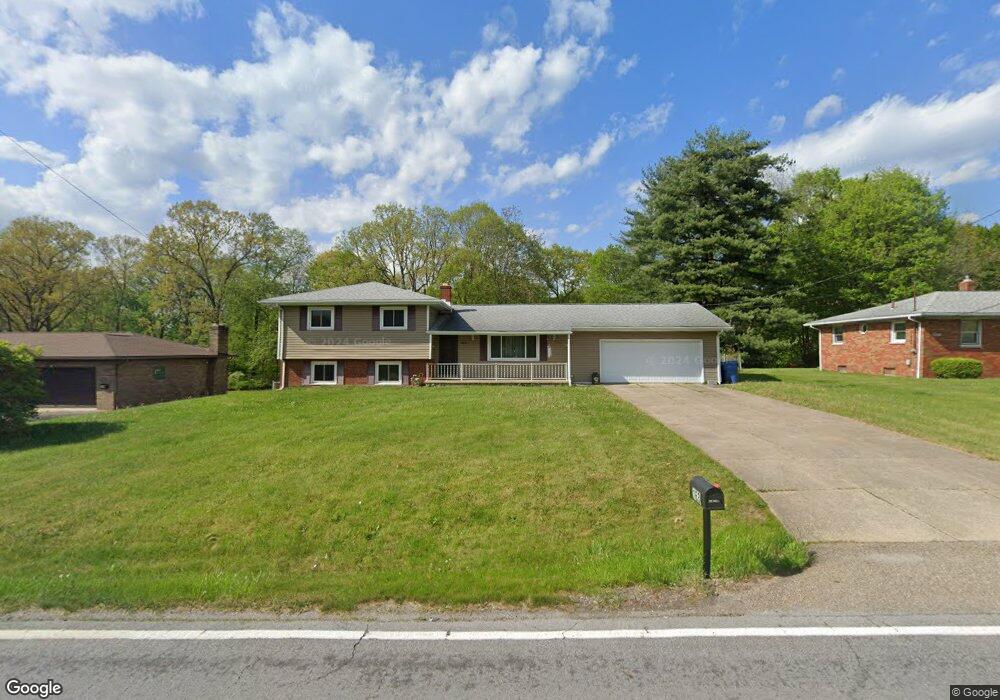
This home is located at 163 Moore Rd, Akron, OH 44319 and is currently estimated at $302,547, approximately $238 per square foot. 163 Moore Rd is a home located in Summit County with nearby schools including Greenwood Elementary School, Green Intermediate Elementary School, and Green Primary School.
Ownership History
Date
Name
Owned For
Owner Type
Purchase Details
Closed on
Jun 21, 2010
Sold by
Sidari Pamela Jean and Lemaster Brenda J
Bought by
Thomas Charles C and Campanella Frances J
Current Estimated Value
Home Financials for this Owner
Home Financials are based on the most recent Mortgage that was taken out on this home.
Original Mortgage
$148,006
Outstanding Balance
$99,542
Interest Rate
5.12%
Mortgage Type
FHA
Estimated Equity
$203,005
Purchase Details
Closed on
Dec 15, 1998
Sold by
Lemaster Hal B and Lemaster Marian C
Bought by
Lemaster Hal B and Lemaster Marian C
Create a Home Valuation Report for This Property
The Home Valuation Report is an in-depth analysis detailing your home's value as well as a comparison with similar homes in the area
Purchase History
| Date | Buyer | Sale Price | Title Company |
|---|---|---|---|
| Thomas Charles C | $150,000 | American Certified Title | |
| Lemaster Hal B | -- | Real Estate Title |
Source: Public Records
Mortgage History
| Date | Status | Borrower | Loan Amount |
|---|---|---|---|
| Open | Thomas Charles C | $148,006 |
Source: Public Records
Tax History
| Year | Tax Paid | Tax Assessment Tax Assessment Total Assessment is a certain percentage of the fair market value that is determined by local assessors to be the total taxable value of land and additions on the property. | Land | Improvement |
|---|---|---|---|---|
| 2025 | $3,549 | $71,873 | $15,978 | $55,895 |
| 2024 | $3,392 | $71,873 | $15,978 | $55,895 |
| 2023 | $3,392 | $71,873 | $15,978 | $55,895 |
| 2022 | $2,867 | $54,583 | $12,103 | $42,480 |
| 2021 | $2,690 | $54,583 | $12,103 | $42,480 |
| 2020 | $2,637 | $54,580 | $12,100 | $42,480 |
| 2019 | $2,494 | $48,350 | $17,420 | $30,930 |
| 2018 | $2,549 | $48,350 | $17,420 | $30,930 |
| 2017 | $2,742 | $48,350 | $17,420 | $30,930 |
| 2016 | $2,701 | $48,350 | $17,420 | $30,930 |
| 2015 | $2,742 | $48,350 | $17,420 | $30,930 |
| 2014 | $2,724 | $48,350 | $17,420 | $30,930 |
| 2013 | $2,481 | $43,700 | $17,420 | $26,280 |
Source: Public Records
Map
Nearby Homes
- 3785 S Main St
- 399 Abbyshire Rd
- 397 Wonder Lake Dr
- 323 Tyson Ave
- 308 E Vista Ave
- 68 Starboard Cir
- 221 Lake Front Dr
- 3273 S Jasmine Ave
- 619 Moore Rd
- 277 Lake Front Dr
- 3809 N Glenridge Rd
- 3812 N Glenridge Rd
- 3272 Doubler Dr
- 265 E Pace Ave
- 4298 S Main St Unit 4302
- 570 E Turkeyfoot Lake Rd
- 3085 Daisy Ave
- 4135 State Park Dr
- 4387 Point Comfort Dr
- 3859 Greenfield Rd
Your Personal Tour Guide
Ask me questions while you tour the home.