163 N 200 W Garland, UT 84312
Estimated Value: $271,000 - $353,000
--
Bed
--
Bath
749
Sq Ft
$394/Sq Ft
Est. Value
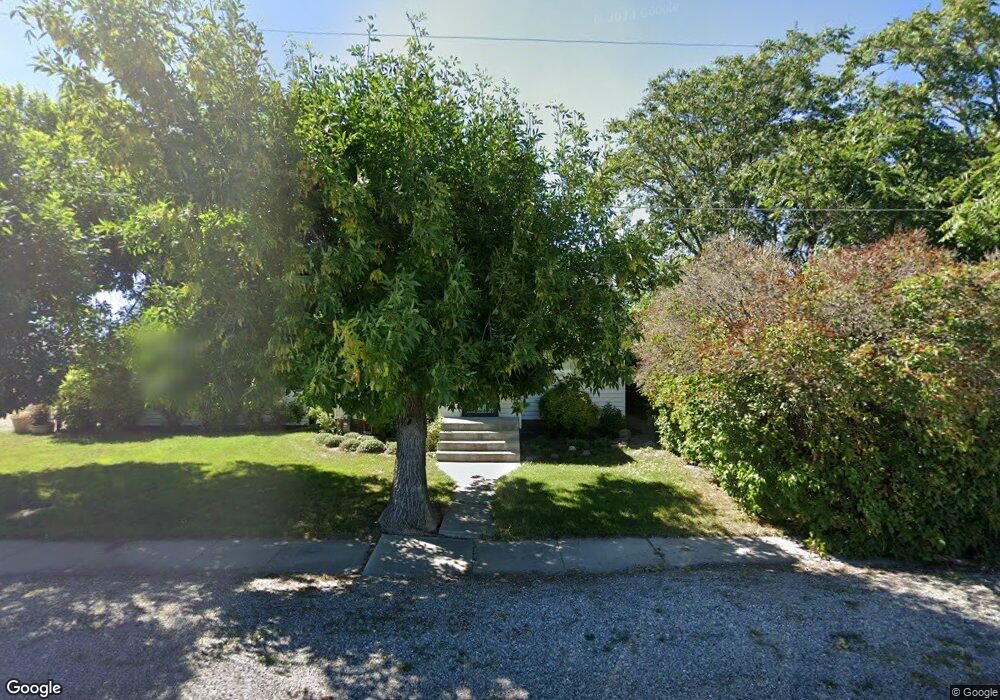
About This Home
This home is located at 163 N 200 W, Garland, UT 84312 and is currently estimated at $295,336, approximately $394 per square foot. 163 N 200 W is a home with nearby schools including Fielding School, Bear River Middle School, and Alice C. Harris Intermediate School.
Ownership History
Date
Name
Owned For
Owner Type
Purchase Details
Closed on
Oct 14, 2025
Sold by
Audrey L Seager Revocable Trust and King Wendy
Bought by
King Colby M and Seager King Wendy
Current Estimated Value
Home Financials for this Owner
Home Financials are based on the most recent Mortgage that was taken out on this home.
Original Mortgage
$128,500
Outstanding Balance
$128,500
Interest Rate
6.5%
Mortgage Type
New Conventional
Estimated Equity
$166,836
Purchase Details
Closed on
Feb 5, 2014
Sold by
Seager Audrey L
Bought by
Seager Audrey L and Audrey L Seager Revocable Trust
Create a Home Valuation Report for This Property
The Home Valuation Report is an in-depth analysis detailing your home's value as well as a comparison with similar homes in the area
Home Values in the Area
Average Home Value in this Area
Purchase History
| Date | Buyer | Sale Price | Title Company |
|---|---|---|---|
| King Colby M | -- | First American Title Insurance | |
| Seager Audrey L | -- | None Available |
Source: Public Records
Mortgage History
| Date | Status | Borrower | Loan Amount |
|---|---|---|---|
| Open | King Colby M | $128,500 |
Source: Public Records
Tax History Compared to Growth
Tax History
| Year | Tax Paid | Tax Assessment Tax Assessment Total Assessment is a certain percentage of the fair market value that is determined by local assessors to be the total taxable value of land and additions on the property. | Land | Improvement |
|---|---|---|---|---|
| 2025 | $1,536 | $234,310 | $105,000 | $129,310 |
| 2024 | $264 | $227,193 | $100,000 | $127,193 |
| 2023 | $1,214 | $205,534 | $90,000 | $115,534 |
| 2022 | $192 | $91,953 | $13,750 | $78,203 |
| 2021 | $828 | $99,579 | $25,000 | $74,579 |
| 2020 | $716 | $99,579 | $25,000 | $74,579 |
| 2019 | $679 | $50,049 | $13,750 | $36,299 |
| 2018 | $63 | $41,395 | $13,750 | $27,645 |
| 2017 | $624 | $75,264 | $13,750 | $50,264 |
| 2016 | $137 | $40,079 | $13,750 | $26,329 |
| 2015 | $8 | $37,685 | $13,750 | $23,935 |
| 2014 | $8 | $36,545 | $13,750 | $22,795 |
| 2013 | -- | $36,546 | $13,338 | $23,208 |
Source: Public Records
Map
Nearby Homes