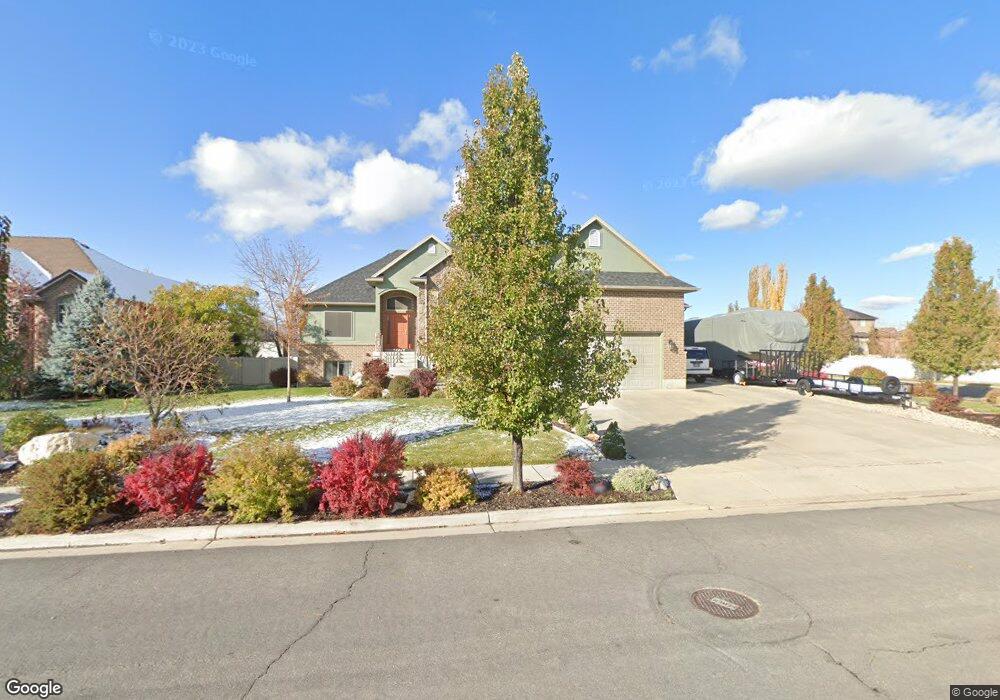
163 N 3425 W Layton, UT 84041
Estimated Value: $717,000 - $810,000
3
Beds
3
Baths
3,828
Sq Ft
$197/Sq Ft
Est. Value
About This Home
This home is located at 163 N 3425 W, Layton, UT 84041 and is currently estimated at $753,724, approximately $196 per square foot. 163 N 3425 W is a home located in Davis County with nearby schools including Sand Springs Elementary School, Legacy Junior High School, and Layton High School.
Ownership History
Date
Name
Owned For
Owner Type
Purchase Details
Closed on
Apr 24, 2018
Sold by
Tucker David S and Tucker Jill B
Bought by
Tucker David S and Tucker Jill B
Current Estimated Value
Home Financials for this Owner
Home Financials are based on the most recent Mortgage that was taken out on this home.
Original Mortgage
$212,500
Outstanding Balance
$182,746
Interest Rate
4.44%
Mortgage Type
New Conventional
Estimated Equity
$570,978
Purchase Details
Closed on
Dec 23, 2013
Sold by
Tucker David S and Tucker David A
Bought by
Tucker David S and Tucker Jill B
Home Financials for this Owner
Home Financials are based on the most recent Mortgage that was taken out on this home.
Original Mortgage
$140,000
Interest Rate
3.87%
Mortgage Type
Adjustable Rate Mortgage/ARM
Purchase Details
Closed on
Dec 4, 2013
Sold by
Mortgage Guaranty Insurance Corp
Bought by
Tucker David A and Tucker David S
Home Financials for this Owner
Home Financials are based on the most recent Mortgage that was taken out on this home.
Original Mortgage
$140,000
Interest Rate
3.87%
Mortgage Type
Adjustable Rate Mortgage/ARM
Purchase Details
Closed on
Sep 4, 2013
Sold by
Federal National Mortgage Association
Bought by
Mortgage Guaranty Insurance Corp
Purchase Details
Closed on
Jun 12, 2013
Sold by
Brooks Robert M and Brooks Melissa
Bought by
Federal National Mortgage Association
Purchase Details
Closed on
Feb 26, 2008
Sold by
Lessig Construction & Pentella Real Esta
Bought by
Brooks Robert M and Brooks Melissa
Home Financials for this Owner
Home Financials are based on the most recent Mortgage that was taken out on this home.
Original Mortgage
$345,800
Interest Rate
5.64%
Mortgage Type
Purchase Money Mortgage
Purchase Details
Closed on
Mar 24, 2006
Sold by
Snow Ron and Lessig Gary
Bought by
Lessig Const & Pentella Real Estate & De
Home Financials for this Owner
Home Financials are based on the most recent Mortgage that was taken out on this home.
Original Mortgage
$300,000
Interest Rate
6.18%
Mortgage Type
Construction
Purchase Details
Closed on
Dec 13, 2005
Sold by
Wight Inc
Bought by
Lessig Gary and Snow Ron
Create a Home Valuation Report for This Property
The Home Valuation Report is an in-depth analysis detailing your home's value as well as a comparison with similar homes in the area
Home Values in the Area
Average Home Value in this Area
Purchase History
| Date | Buyer | Sale Price | Title Company |
|---|---|---|---|
| Tucker David S | -- | Mountain View Title | |
| Tucker David S | -- | Founders Title Co S | |
| Tucker David A | -- | Founders Title Co S | |
| Mortgage Guaranty Insurance Corp | -- | Founders Title Co | |
| Federal National Mortgage Association | $263,500 | Title Insurance Age | |
| Brooks Robert M | -- | Bonneville Superior Title Co | |
| Lessig Const & Pentella Real Estate & De | -- | Hickman Land Title Co | |
| Lessig Gary | -- | Bonneville Title Company |
Source: Public Records
Mortgage History
| Date | Status | Borrower | Loan Amount |
|---|---|---|---|
| Open | Tucker David S | $212,500 | |
| Closed | Tucker David A | $140,000 | |
| Previous Owner | Brooks Robert M | $345,800 | |
| Previous Owner | Lessig Const & Pentella Real Estate & De | $300,000 |
Source: Public Records
Tax History Compared to Growth
Tax History
| Year | Tax Paid | Tax Assessment Tax Assessment Total Assessment is a certain percentage of the fair market value that is determined by local assessors to be the total taxable value of land and additions on the property. | Land | Improvement |
|---|---|---|---|---|
| 2025 | $3,736 | $392,150 | $134,076 | $258,074 |
| 2024 | $3,579 | $378,400 | $141,756 | $236,644 |
| 2023 | $3,477 | $648,000 | $153,702 | $494,298 |
| 2022 | $3,690 | $373,450 | $87,092 | $286,358 |
| 2021 | $3,418 | $516,000 | $130,600 | $385,400 |
| 2020 | $3,087 | $447,000 | $112,243 | $334,757 |
| 2019 | $3,003 | $426,000 | $109,352 | $316,648 |
| 2018 | $2,788 | $397,000 | $96,542 | $300,458 |
| 2016 | $2,602 | $191,125 | $40,938 | $150,187 |
| 2015 | $2,510 | $175,065 | $40,938 | $134,127 |
| 2014 | $2,255 | $160,769 | $40,938 | $119,831 |
| 2013 | -- | $164,641 | $42,052 | $122,589 |
Source: Public Records
Map
Nearby Homes
- 101 S 3600 W
- 454 N 3550 W
- 567 W 3575 S
- 3583 W 200 S
- 245 S Summer Breeze Ln
- 3535 W Overlook Dr
- 3169 S 550 W
- 697 N 3275 W
- 3263 W 850 N
- 2794 W Gentile St
- 967 W Yamada Ct
- 803 W 2800 S
- 2674 S 75 E
- 3391 W 1125 N
- 3528 S Finch St
- 1139 W 3150 S
- 2681 S 200 E
- 2875 N Hill Rd Unit 199
- 2875 N Hill Rd Unit 27
- 162 E 2600 S