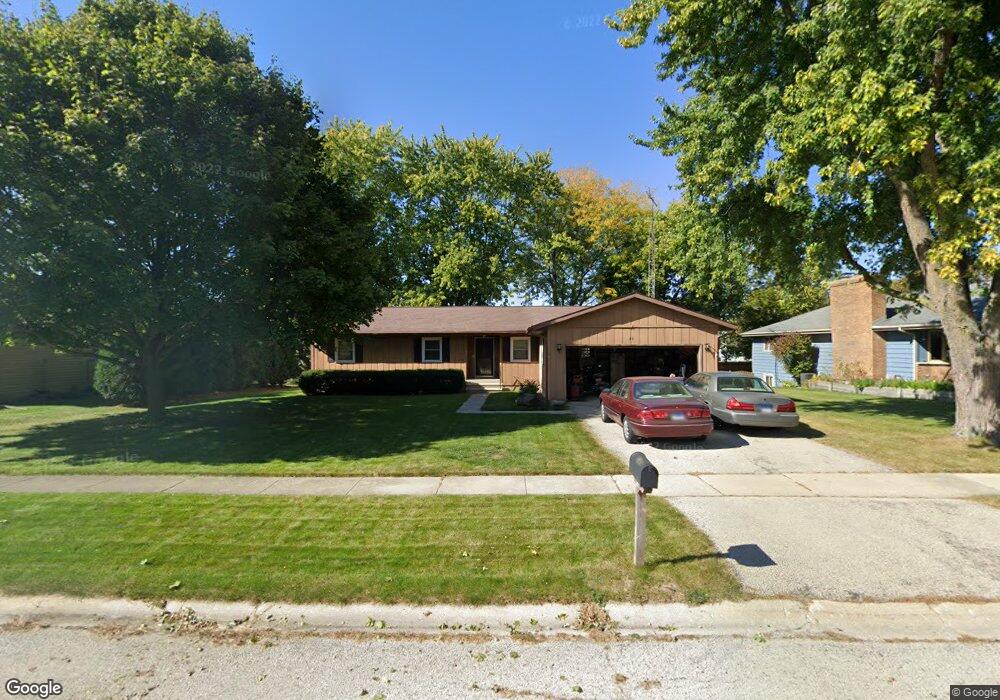
163 N Aspen Dr Cortland, IL 60112
Estimated Value: $266,000 - $315,000
1
Bed
3
Baths
1,620
Sq Ft
$182/Sq Ft
Est. Value
About This Home
This home is located at 163 N Aspen Dr, Cortland, IL 60112 and is currently estimated at $295,475, approximately $182 per square foot. 163 N Aspen Dr is a home located in DeKalb County with nearby schools including Cortland Elementary School, Huntley Middle School, and De Kalb High School.
Create a Home Valuation Report for This Property
The Home Valuation Report is an in-depth analysis detailing your home's value as well as a comparison with similar homes in the area
Home Values in the Area
Average Home Value in this Area
Tax History Compared to Growth
Tax History
| Year | Tax Paid | Tax Assessment Tax Assessment Total Assessment is a certain percentage of the fair market value that is determined by local assessors to be the total taxable value of land and additions on the property. | Land | Improvement |
|---|---|---|---|---|
| 2024 | $6,960 | $85,795 | $16,003 | $69,792 |
| 2023 | $6,960 | $80,264 | $14,971 | $65,293 |
| 2022 | $6,588 | $72,118 | $14,288 | $57,830 |
| 2021 | $6,181 | $64,342 | $13,604 | $50,738 |
| 2020 | $6,173 | $62,335 | $13,180 | $49,155 |
| 2019 | $5,974 | $59,719 | $12,627 | $47,092 |
| 2018 | $6,367 | $61,620 | $13,110 | $48,510 |
| 2017 | $6,269 | $58,663 | $12,481 | $46,182 |
| 2016 | $5,982 | $55,134 | $11,730 | $43,404 |
| 2015 | -- | $51,774 | $11,015 | $40,759 |
| 2014 | -- | $44,183 | $10,602 | $33,581 |
| 2013 | -- | $45,786 | $10,987 | $34,799 |
Source: Public Records
Map
Nearby Homes
- 167 W Carol Ave
- Lot B6 W Paw Ave
- Lot B5 W Paw Ave
- 95 Lots Chestnut Grove
- 300 N Aspen Dr
- 241 N Somonauk Rd
- 329 N Aspen Dr
- 335 N Aspen Dr
- 341 N Aspen Dr
- 347 N Aspen Dr
- 353 N Aspen Dr
- 86 E Daisy Ave
- 67 S Somonauk Rd
- 437 N Charles St Unit 7
- 233 Judy Ln
- 189 E Lark Ave
- Lot A16 Llanos St
- Lot B16 Llanos St
- 154 S Llanos St
- 152 S Llanos St
- 167 N Aspen Dr
- 151 N Aspen Dr
- 164 N Aspen Dr
- 143 N Aspen Dr
- 160 N Hickory St
- 160 N Hickory St
- 170 N Hickory St
- 149 W Susan Ave
- 166 W Ellen Ave
- 180 W Ellen Ave
- 179 W Carol Ave
- 178 N Aspen Dr
- 150 N Hickory St
- 165 N Hickory St
- 167 W Carol Ave
- 148 W Susan Ave
- 140 W Ellen Ave
- 190 W Ellen Ave
- 133 W Susan Ave
- 121 W Susan Ave