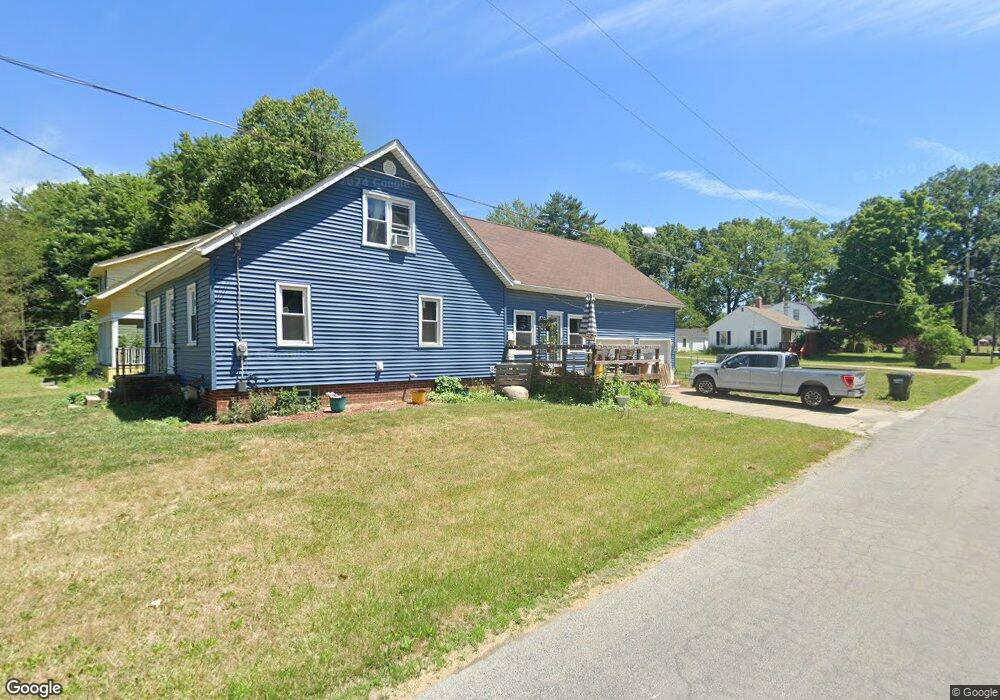
163 N Main St West Salem, OH 44287
Estimated Value: $171,000 - $271,000
3
Beds
2
Baths
2,080
Sq Ft
$97/Sq Ft
Est. Value
About This Home
This home is located at 163 N Main St, West Salem, OH 44287 and is currently estimated at $201,098, approximately $96 per square foot. 163 N Main St is a home located in Wayne County with nearby schools including Northwestern Elementary School, Northwestern Middle School, and Northwestern High School.
Ownership History
Date
Name
Owned For
Owner Type
Purchase Details
Closed on
Nov 7, 2011
Sold by
Geitgey Adam C and Geitgey Lacye R
Bought by
Spencer Gary E and Spencer Kathleen J
Current Estimated Value
Purchase Details
Closed on
Dec 17, 2007
Sold by
Sfjv 2005 Llc
Bought by
Geitgey Adam C and Geitgey Lacye R
Home Financials for this Owner
Home Financials are based on the most recent Mortgage that was taken out on this home.
Original Mortgage
$83,000
Interest Rate
6.27%
Mortgage Type
New Conventional
Purchase Details
Closed on
Aug 31, 2007
Sold by
Maynard Gregory L and Smith Maynard Tonya J
Bought by
Sfjv 2005 Llc
Purchase Details
Closed on
May 5, 2000
Sold by
Nichols Elena
Bought by
Maynard Gregory L and Maynard Tonya J
Home Financials for this Owner
Home Financials are based on the most recent Mortgage that was taken out on this home.
Original Mortgage
$94,666
Interest Rate
8.24%
Mortgage Type
FHA
Create a Home Valuation Report for This Property
The Home Valuation Report is an in-depth analysis detailing your home's value as well as a comparison with similar homes in the area
Home Values in the Area
Average Home Value in this Area
Purchase History
| Date | Buyer | Sale Price | Title Company |
|---|---|---|---|
| Spencer Gary E | $80,000 | Southern Title-Joey | |
| Geitgey Adam C | $83,000 | Accutitle Agency Inc | |
| Sfjv 2005 Llc | $72,667 | None Available | |
| Maynard Gregory L | $95,000 | -- |
Source: Public Records
Mortgage History
| Date | Status | Borrower | Loan Amount |
|---|---|---|---|
| Previous Owner | Geitgey Adam C | $83,000 | |
| Previous Owner | Maynard Gregory L | $94,666 |
Source: Public Records
Tax History Compared to Growth
Tax History
| Year | Tax Paid | Tax Assessment Tax Assessment Total Assessment is a certain percentage of the fair market value that is determined by local assessors to be the total taxable value of land and additions on the property. | Land | Improvement |
|---|---|---|---|---|
| 2024 | $1,411 | $33,570 | $10,230 | $23,340 |
| 2023 | $1,343 | $33,570 | $10,230 | $23,340 |
| 2022 | $1,249 | $28,210 | $8,600 | $19,610 |
| 2021 | $1,216 | $28,210 | $8,600 | $19,610 |
| 2020 | $1,256 | $28,210 | $8,600 | $19,610 |
| 2019 | $1,434 | $30,110 | $8,030 | $22,080 |
| 2018 | $1,411 | $30,110 | $8,030 | $22,080 |
| 2017 | $1,341 | $30,110 | $8,030 | $22,080 |
| 2016 | $1,272 | $28,950 | $7,720 | $21,230 |
| 2015 | $1,213 | $28,950 | $7,720 | $21,230 |
| 2014 | $1,227 | $28,950 | $7,720 | $21,230 |
| 2013 | $1,478 | $33,910 | $10,870 | $23,040 |
Source: Public Records
Map
Nearby Homes
- 64 N Main St
- 113 Flemming Rd
- 0 Congress Unit 5159386
- 0 Congress Unit 229574
- 0 Congress Unit 5150334
- 0 Jeffrey Rd Unit LotWP001
- 0 Jeffrey Rd
- 12516 Congress Rd
- 107 County Road 500
- 58 State Route 42
- 566 County Road 175
- 0 Township Road 810
- 195 County Road 620
- 9835 Congress Rd
- 12042 Greenwich Rd
- 9690 Firestone Rd
- 2199 Brassica Ln
- 10229 Crawford Rd
- 10933 SiMcOx Rd
- 11282 Stratton Rd