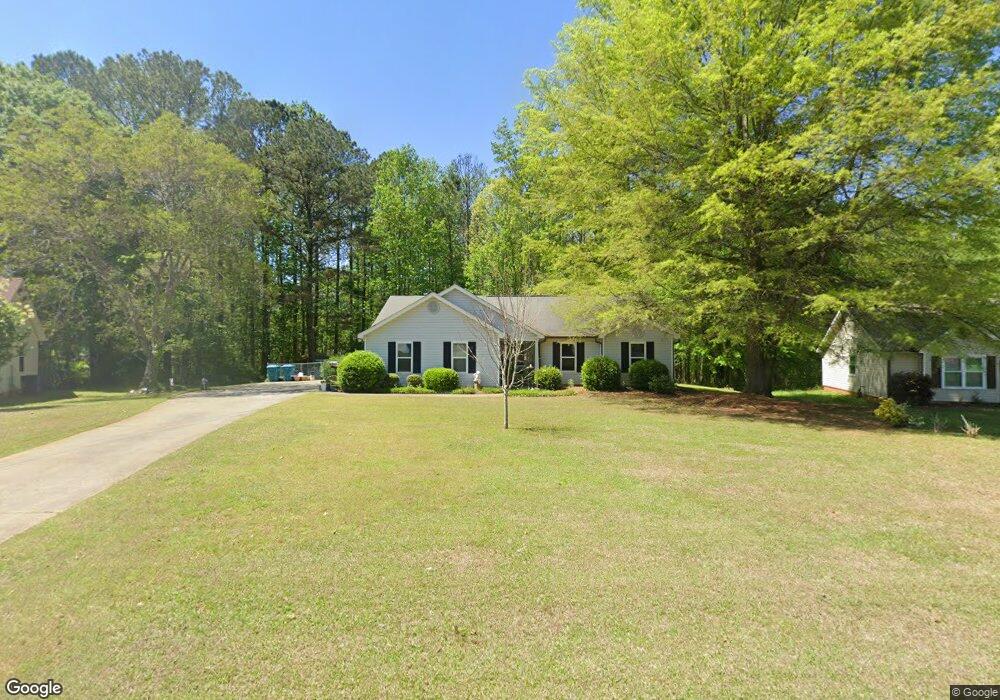
163 Nicki Ct Unit 2 Hampton, GA 30228
Estimated Value: $212,000 - $254,000
3
Beds
2
Baths
1,342
Sq Ft
$174/Sq Ft
Est. Value
About This Home
This home is located at 163 Nicki Ct Unit 2, Hampton, GA 30228 and is currently estimated at $233,032, approximately $173 per square foot. 163 Nicki Ct Unit 2 is a home located in Henry County with nearby schools including Hampton Elementary School, Hampton Middle School, and Hampton High School.
Ownership History
Date
Name
Owned For
Owner Type
Purchase Details
Closed on
May 20, 2025
Sold by
Poole Lois
Bought by
Poole Lois and Mathis Charline D
Current Estimated Value
Purchase Details
Closed on
Sep 28, 2022
Sold by
Mathis Charline Diane
Bought by
Poole Lois
Purchase Details
Closed on
Nov 26, 2018
Sold by
Poole Lois
Bought by
Poole Lois and Mathis Charline Diane
Purchase Details
Closed on
Sep 12, 2018
Sold by
Acree Eric
Bought by
Poole Lois
Purchase Details
Closed on
Aug 20, 2013
Sold by
Poole Lois
Bought by
Poole Lois and Acree Eric Eugene
Purchase Details
Closed on
Apr 20, 2012
Sold by
Poole Lois
Bought by
Poole Lois and Mathis Charlene
Purchase Details
Closed on
Nov 20, 2006
Sold by
Equity Trust Co
Bought by
Poole Lois
Purchase Details
Closed on
Jul 14, 2006
Sold by
Secretary Of Hud
Bought by
Ira William J Stoll Iii
Purchase Details
Closed on
Sep 6, 2005
Sold by
Wells Fargo Bk Na
Bought by
Hud
Purchase Details
Closed on
May 23, 1996
Sold by
D N Homes
Bought by
Lee Larry
Create a Home Valuation Report for This Property
The Home Valuation Report is an in-depth analysis detailing your home's value as well as a comparison with similar homes in the area
Home Values in the Area
Average Home Value in this Area
Purchase History
| Date | Buyer | Sale Price | Title Company |
|---|---|---|---|
| Poole Lois | -- | -- | |
| Poole Lois | -- | -- | |
| Poole Lois | -- | -- | |
| Poole Lois | -- | -- | |
| Poole Lois | -- | -- | |
| Poole Lois | -- | -- | |
| Poole Lois | $118,000 | -- | |
| Ira William J Stoll Iii | -- | -- | |
| Hud | -- | -- | |
| Wells Fargo Bk Na | $132,379 | -- | |
| Lee Larry | $81,400 | -- |
Source: Public Records
Mortgage History
| Date | Status | Borrower | Loan Amount |
|---|---|---|---|
| Closed | Lee Larry | $0 |
Source: Public Records
Tax History
| Year | Tax Paid | Tax Assessment Tax Assessment Total Assessment is a certain percentage of the fair market value that is determined by local assessors to be the total taxable value of land and additions on the property. | Land | Improvement |
|---|---|---|---|---|
| 2025 | $596 | $95,200 | $12,000 | $83,200 |
| 2024 | $596 | $93,720 | $12,000 | $81,720 |
| 2023 | $523 | $92,280 | $10,000 | $82,280 |
| 2022 | $703 | $72,160 | $10,000 | $62,160 |
| 2021 | $380 | $60,040 | $10,000 | $50,040 |
| 2020 | $380 | $51,320 | $10,000 | $41,320 |
| 2019 | $293 | $47,720 | $8,000 | $39,720 |
| 2018 | $0 | $41,880 | $8,000 | $33,880 |
| 2016 | $293 | $37,840 | $6,000 | $31,840 |
| 2015 | -- | $33,320 | $6,000 | $27,320 |
| 2014 | -- | $25,400 | $4,000 | $21,400 |
Source: Public Records
Map
Nearby Homes
- 130 Nicki Ct
- 218 Nicki Ct
- 130 Glenwood Ct
- 9 Ridge Dr
- 244 Wallingford Dr
- 113 Canal St
- 337 Amsterdam Way
- 640 Edgar St
- 400 Beachview Rd
- 133 Canal St
- 150 Oxford Cir
- 2 Cindy Ct
- 192 Oxford Cir
- 14803 Woolsey Rd
- Somerset Plan at Oakchase at Hampton
- Saratoga Plan at Oakchase at Hampton
- Hamlin Plan at Oakchase at Hampton
- Celia Plan at Oakchase at Hampton
- Hayden Plan at Oakchase at Hampton
- Packard Plan at Oakchase at Hampton
- 155 Nicki Ct
- 171 Nicki Ct
- 147 Nicki Ct
- 179 Nicki Ct Unit 2
- 178 Nicki Ct Unit 2
- 154 Nicki Ct
- 139 Nicki Ct Unit II
- 187 Nicki Ct
- 186 Nicki Ct
- 131 Nicki Ct
- 170 Glenwood Ct
- 195 Nicki Ct Unit II
- 210 Nicki Ct Unit 2
- 122 Nicki Ct Unit 2
- 123 Nicki Ct
- 203 Nicki Ct
- 203 Nicki Ct
- 171 Glenwood Ct
- 114 Nicki Ct
- 115 Nicki Ct
Your Personal Tour Guide
Ask me questions while you tour the home.