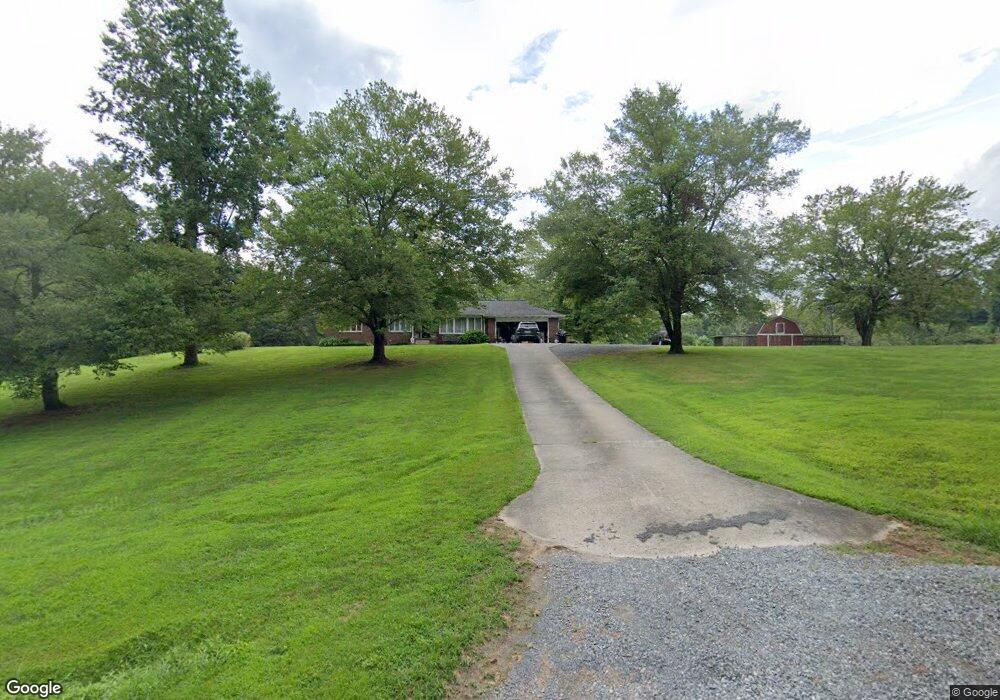
163 Old Clear Creek Rd Ellijay, GA 30536
Estimated Value: $434,570 - $542,000
3
Beds
2
Baths
1,558
Sq Ft
$324/Sq Ft
Est. Value
About This Home
This home is located at 163 Old Clear Creek Rd, Ellijay, GA 30536 and is currently estimated at $504,643, approximately $323 per square foot. 163 Old Clear Creek Rd is a home located in Gilmer County with nearby schools including Ellijay Elementary School, Clear Creek Elementary School, and Clear Creek Middle School.
Ownership History
Date
Name
Owned For
Owner Type
Purchase Details
Closed on
Jul 11, 2006
Sold by
Bassett Jimmy L
Bought by
Reece Adam and Reece Candra
Current Estimated Value
Home Financials for this Owner
Home Financials are based on the most recent Mortgage that was taken out on this home.
Original Mortgage
$199,200
Outstanding Balance
$116,683
Interest Rate
6.6%
Mortgage Type
New Conventional
Estimated Equity
$387,960
Purchase Details
Closed on
Sep 12, 2005
Sold by
Thomas Imogene
Bought by
Bassett Jimmy L and Bassett Dedra Nichol
Home Financials for this Owner
Home Financials are based on the most recent Mortgage that was taken out on this home.
Original Mortgage
$60,000
Interest Rate
5.86%
Mortgage Type
New Conventional
Purchase Details
Closed on
Jun 21, 2004
Sold by
Thomas Harold
Bought by
Thomas Harold G and Thomas Imogene
Create a Home Valuation Report for This Property
The Home Valuation Report is an in-depth analysis detailing your home's value as well as a comparison with similar homes in the area
Home Values in the Area
Average Home Value in this Area
Purchase History
| Date | Buyer | Sale Price | Title Company |
|---|---|---|---|
| Reece Adam | $249,000 | -- | |
| Bassett Jimmy L | $170,000 | -- | |
| Thomas Harold G | -- | -- | |
| Thomas Harold | -- | -- |
Source: Public Records
Mortgage History
| Date | Status | Borrower | Loan Amount |
|---|---|---|---|
| Open | Reece Adam | $199,200 | |
| Previous Owner | Bassett Jimmy L | $60,000 |
Source: Public Records
Tax History Compared to Growth
Tax History
| Year | Tax Paid | Tax Assessment Tax Assessment Total Assessment is a certain percentage of the fair market value that is determined by local assessors to be the total taxable value of land and additions on the property. | Land | Improvement |
|---|---|---|---|---|
| 2025 | $1,800 | $142,880 | $30,240 | $112,640 |
| 2024 | $1,800 | $141,112 | $27,480 | $113,632 |
| 2023 | $1,816 | $136,672 | $23,040 | $113,632 |
| 2022 | $1,821 | $118,832 | $23,040 | $95,792 |
| 2021 | $1,741 | $93,752 | $20,200 | $73,552 |
| 2020 | $1,671 | $77,872 | $19,720 | $58,152 |
| 2019 | $1,721 | $77,872 | $19,720 | $58,152 |
| 2018 | $1,678 | $77,872 | $19,720 | $58,152 |
| 2017 | $1,374 | $57,724 | $19,720 | $38,004 |
| 2016 | $1,434 | $59,016 | $19,720 | $39,296 |
| 2015 | $1,142 | $48,232 | $13,320 | $34,912 |
| 2014 | $1,200 | $48,736 | $13,320 | $35,416 |
| 2013 | -- | $51,692 | $15,960 | $35,732 |
Source: Public Records
Map
Nearby Homes
- 31&32 Fox Paw Leaf Ln
- LOT 26 Fox Paw Leaf Ln
- 0 Foxpaw Leaf Ln Unit LOT 20
- 0 Foxpaw Leaf Ln Unit 38
- 0 Foxpaw Leaf Ln Unit 7675080
- 0 Foxpaw Leaf Ln Unit 7675161
- 0 Foxpaw Leaf Ln Unit 420583
- 83 Licklog Rd
- 0 Oval Leaf Ln Unit 419179
- 143 Hidden Lake Cir
- 77 Long View Ln
- 1930 Blackberry Mountain Rd
- 50 Misty Oaks Ct
- 3214 Lower Cartecay Rd
- 1319 Henry Evans Rd
- 140 Robert Dr
- 105 Riveredge Dr
- LOT 10 Johnson Mill Rd
- 44 Cartecay Ct
- 91 Old Clear Creek Rd
- 0 Clear Creek Rd Unit 4 8395181
- 0 Clear Creek Rd
- 0 Clear Creek Rd Unit 303313
- 0 Clear Creek Rd Unit 273322
- 0 Clear Creek Rd Unit 115927
- 0 Clear Creek Rd Unit 10146305
- 0 Clear Creek Rd Unit 323300
- 0 Clear Creek Rd Unit 30 AC 9062684
- 0 Clear Creek Rd Unit 28AC 9062679
- 0 Clear Creek Rd Unit 8728602
- 0 Clear Creek Rd Unit 4008668
- 0 Clear Creek Rd Unit 8909497
- 0 Clear Creek Rd Unit 6825111
- 0 Clear Creek Rd Unit 8836213
- 0 Clear Creek Rd Unit 6764070
- 0 Clear Creek Rd Unit 8553510
- 170 Old Clear Creek Rd
- 2058 Lower Cartecay Rd
- 2158 Lower Cartecay Rd