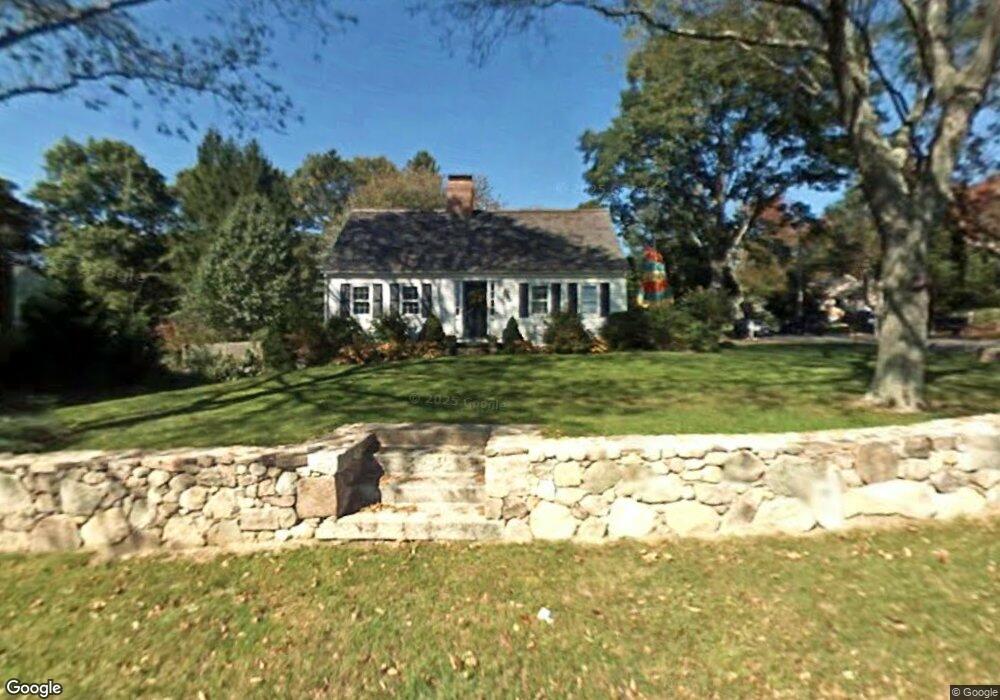
163 Pond St Cohasset, MA 02025
Estimated Value: $1,125,000 - $1,479,000
5
Beds
6
Baths
2,154
Sq Ft
$597/Sq Ft
Est. Value
About This Home
This home is located at 163 Pond St, Cohasset, MA 02025 and is currently estimated at $1,286,446, approximately $597 per square foot. 163 Pond St is a home located in Norfolk County with nearby schools including Joseph Osgood School, Deer Hill School, and Cohasset Middle School.
Ownership History
Date
Name
Owned For
Owner Type
Purchase Details
Closed on
Apr 25, 1997
Sold by
Wahle Charles J and Wahle Beth K
Bought by
Curley Joseph M and Curley Lauren P
Current Estimated Value
Purchase Details
Closed on
Sep 1, 1994
Sold by
Woodman Stephen C and Woodman Kathleen A
Bought by
Wahle Charles J and Wahle Beth K
Purchase Details
Closed on
Jun 30, 1989
Sold by
Dinicola Anthony
Bought by
Woodman Stephen C
Create a Home Valuation Report for This Property
The Home Valuation Report is an in-depth analysis detailing your home's value as well as a comparison with similar homes in the area
Home Values in the Area
Average Home Value in this Area
Purchase History
| Date | Buyer | Sale Price | Title Company |
|---|---|---|---|
| Curley Joseph M | $277,900 | -- | |
| Curley Joseph M | $277,900 | -- | |
| Wahle Charles J | $202,500 | -- | |
| Wahle Charles J | $202,500 | -- | |
| Woodman Stephen C | $195,000 | -- | |
| Woodman Stephen C | $195,000 | -- |
Source: Public Records
Mortgage History
| Date | Status | Borrower | Loan Amount |
|---|---|---|---|
| Open | Woodman Stephen C | $262,000 | |
| Closed | Woodman Stephen C | $262,700 |
Source: Public Records
Tax History Compared to Growth
Tax History
| Year | Tax Paid | Tax Assessment Tax Assessment Total Assessment is a certain percentage of the fair market value that is determined by local assessors to be the total taxable value of land and additions on the property. | Land | Improvement |
|---|---|---|---|---|
| 2025 | $10,219 | $882,500 | $479,500 | $403,000 |
| 2024 | $10,066 | $827,100 | $383,600 | $443,500 |
| 2023 | $9,757 | $826,900 | $383,400 | $443,500 |
| 2022 | $9,698 | $772,100 | $383,400 | $388,700 |
| 2021 | $9,663 | $741,000 | $383,400 | $357,600 |
| 2020 | $9,149 | $705,400 | $347,800 | $357,600 |
| 2019 | $9,100 | $705,400 | $347,800 | $357,600 |
| 2018 | $9,022 | $705,400 | $347,800 | $357,600 |
| 2017 | $8,532 | $653,300 | $316,200 | $337,100 |
| 2016 | $8,415 | $653,300 | $316,200 | $337,100 |
| 2015 | $8,303 | $653,300 | $316,200 | $337,100 |
| 2014 | $8,192 | $653,300 | $316,200 | $337,100 |
Source: Public Records
Map
Nearby Homes
- 46 Pond St
- 78 Old Pasture Rd
- 73 Pond St
- 119 Pleasant St
- 100 Pond St Unit 10
- 31 Chittenden Ln Unit 31
- 26 Ash St
- 40 Pond St
- 15 Cushing Rd
- 89 Ripley Rd
- 25 Ripley Rd
- 212 S Main St
- 137 Fairoaks Ln
- 309 S Main St
- 128 Elm St Unit 211
- 40 Brewster Rd
- 146 N Main St Unit 146
- 98 Black Horse Ln
- 87 Elm St Unit 215
- 11 Beach St