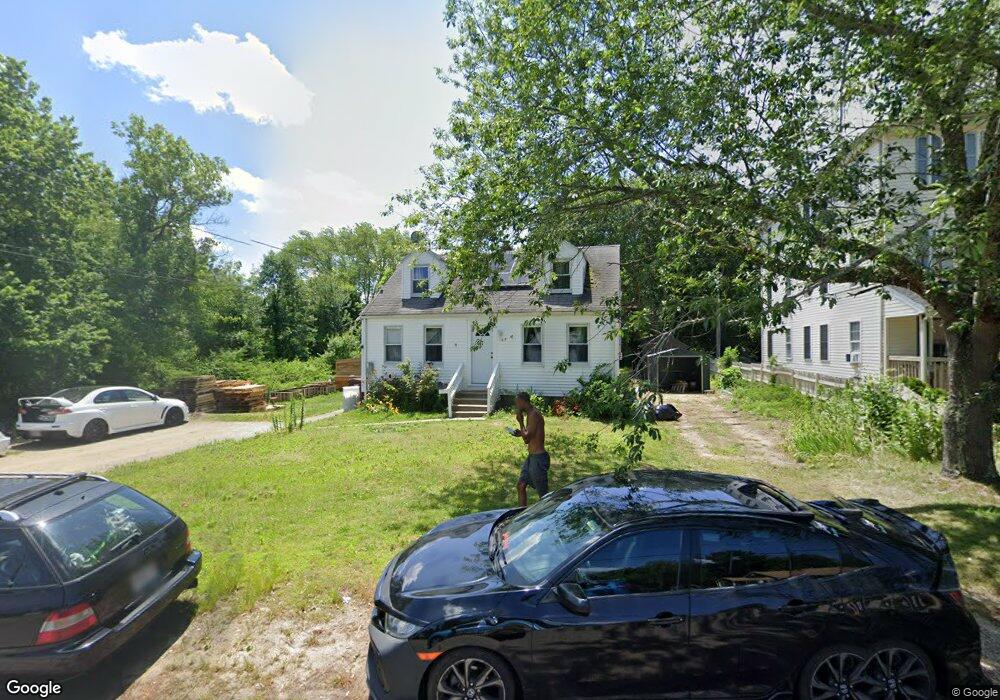
163 Spring St Unit Whole House Bridgewater, MA 02324
Estimated Value: $400,000 - $536,000
4
Beds
2
Baths
1,500
Sq Ft
$315/Sq Ft
Est. Value
About This Home
This home is located at 163 Spring St Unit Whole House, Bridgewater, MA 02324 and is currently estimated at $472,223, approximately $314 per square foot. 163 Spring St Unit Whole House is a home located in Plymouth County with nearby schools including Mitchell Elementary School, Williams Intermediate School, and Bridgewater Middle School.
Ownership History
Date
Name
Owned For
Owner Type
Purchase Details
Closed on
Feb 15, 2024
Sold by
Adga Re Management Llc
Bought by
Nannapaneni Pooja L
Current Estimated Value
Purchase Details
Closed on
Jan 1, 2021
Sold by
Spring St Bridgewater Rt and Haseotes
Bought by
Adga Re Management Llc
Purchase Details
Closed on
Aug 15, 2008
Sold by
Balboni Patricia M
Bought by
Spring St Bridgewater and Boukouvalas
Home Financials for this Owner
Home Financials are based on the most recent Mortgage that was taken out on this home.
Original Mortgage
$155,890
Interest Rate
6.43%
Purchase Details
Closed on
Aug 23, 2004
Sold by
Balboni Patricia M and Balboni Richard F
Bought by
Balboni Patricia M
Purchase Details
Closed on
Oct 20, 1994
Sold by
Yurkstas A Albert
Bought by
Balboni Frances R
Create a Home Valuation Report for This Property
The Home Valuation Report is an in-depth analysis detailing your home's value as well as a comparison with similar homes in the area
Home Values in the Area
Average Home Value in this Area
Purchase History
| Date | Buyer | Sale Price | Title Company |
|---|---|---|---|
| Nannapaneni Pooja L | $345,000 | None Available | |
| Nannapaneni Pooja L | $345,000 | None Available | |
| Adga Re Management Llc | -- | None Available | |
| Adga Re Management Llc | -- | None Available | |
| Spring St Bridgewater | $195,000 | -- | |
| Spring St Bridgewater | $195,000 | -- | |
| Balboni Patricia M | -- | -- | |
| Balboni Patricia M | -- | -- | |
| Balboni Frances R | $119,900 | -- |
Source: Public Records
Mortgage History
| Date | Status | Borrower | Loan Amount |
|---|---|---|---|
| Previous Owner | Balboni Frances R | $155,890 | |
| Previous Owner | Balboni Frances R | $201,500 |
Source: Public Records
Tax History Compared to Growth
Tax History
| Year | Tax Paid | Tax Assessment Tax Assessment Total Assessment is a certain percentage of the fair market value that is determined by local assessors to be the total taxable value of land and additions on the property. | Land | Improvement |
|---|---|---|---|---|
| 2025 | $4,846 | $409,600 | $169,100 | $240,500 |
| 2024 | $4,721 | $388,900 | $152,100 | $236,800 |
| 2023 | $4,671 | $363,800 | $142,200 | $221,600 |
| 2022 | $4,575 | $319,500 | $124,700 | $194,800 |
| 2021 | $3,976 | $274,600 | $111,400 | $163,200 |
| 2020 | $3,582 | $243,200 | $107,100 | $136,100 |
| 2019 | $3,424 | $230,900 | $107,100 | $123,800 |
| 2018 | $3,410 | $224,500 | $116,200 | $108,300 |
| 2017 | $3,353 | $214,800 | $116,200 | $98,600 |
| 2016 | $3,232 | $208,000 | $114,000 | $94,000 |
| 2015 | $3,170 | $195,200 | $104,800 | $90,400 |
| 2014 | $3,130 | $192,600 | $101,700 | $90,900 |
Source: Public Records
Map
Nearby Homes
- 167 Spring St
- 128 Broad St
- 12 Perkins St
- 16 Cassidy Place Unit 16
- 2 Fontana Way
- Lot 3 Fontana Way
- 48 Pearl St
- 398 Plymouth St
- 130 Maple Ave
- Lot 1 Hammond St
- 29 Leonard St Unit 29
- 35 Leonard St Unit 35
- 74 Mount Prospect St
- 211 Oak St
- 180 Main St Unit C55
- 180 Main St Unit 6-203
- 55 Edge Hill Dr
- 220 Bedford St Unit D-5
- 45 Edge Hill Dr Unit 47
- 40 Old Forge Rd Unit 40
- 163 Spring St
- 163 Spring St
- 161 Spring St
- 161 Spring St Unit 3
- 161 Spring St Unit 2
- 153 Spring St
- 148 Spring St
- 178 Spring St
- 178 Spring St
- 147 Spring St
- 182 Spring St
- 184 Spring St
- 152 Plymouth St
- 152 Plymouth St Unit 1
- 152 Plymouth St Unit 3
- 152 Plymouth St Unit 2
- 134 Spring St
- 144 Plymouth St
- 118 Plymouth St
- 118 Plymouth St Unit 1 and 2