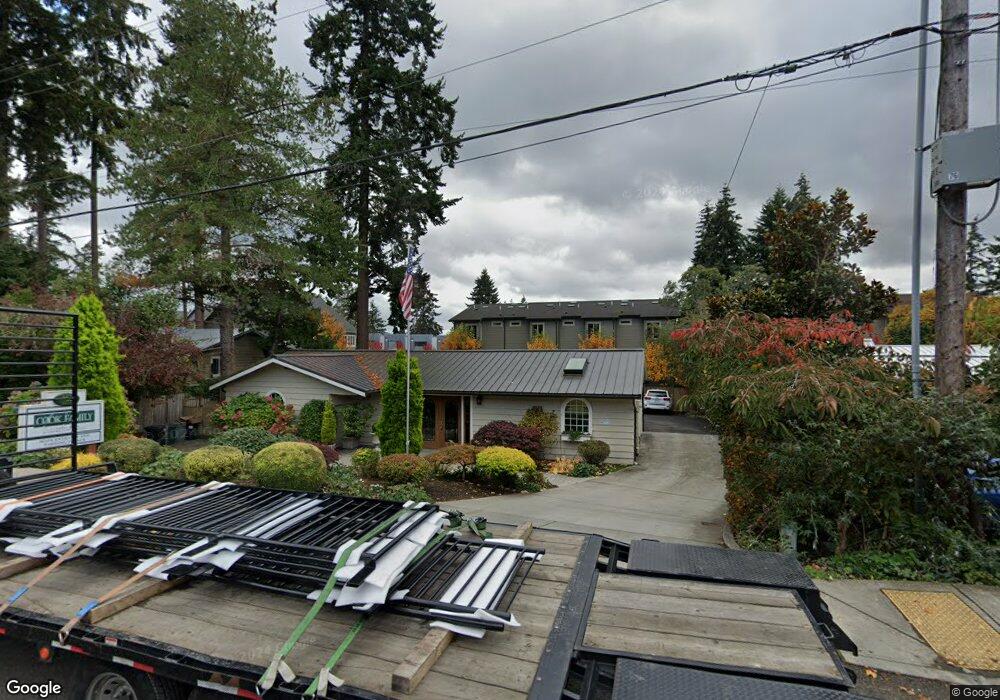
163 Wyatt Way NE Bainbridge Island, WA 98110
Estimated Value: $928,000 - $1,298,000
2
Beds
1
Bath
1,368
Sq Ft
$773/Sq Ft
Est. Value
About This Home
This home is located at 163 Wyatt Way NE, Bainbridge Island, WA 98110 and is currently estimated at $1,057,641, approximately $773 per square foot. 163 Wyatt Way NE is a home with nearby schools including Bainbridge High School, Madrona School, and St. Cecilia Catholic School.
Ownership History
Date
Name
Owned For
Owner Type
Purchase Details
Closed on
Feb 27, 2018
Sold by
Cook Properties Llc
Bought by
Hahn Dinan Llc
Current Estimated Value
Purchase Details
Closed on
May 21, 2007
Sold by
Cook David J
Bought by
Cook Properties Llc
Purchase Details
Closed on
May 25, 2005
Sold by
Kass Mary T and Kass Kent E
Bought by
Cook David J
Home Financials for this Owner
Home Financials are based on the most recent Mortgage that was taken out on this home.
Original Mortgage
$734,000
Interest Rate
5.84%
Mortgage Type
Small Business Administration
Purchase Details
Closed on
Sep 15, 1997
Sold by
Diggs William D and Diggs Polly A
Bought by
Kass Kent E and Kass Mary T
Home Financials for this Owner
Home Financials are based on the most recent Mortgage that was taken out on this home.
Original Mortgage
$135,000
Interest Rate
7.45%
Mortgage Type
Seller Take Back
Create a Home Valuation Report for This Property
The Home Valuation Report is an in-depth analysis detailing your home's value as well as a comparison with similar homes in the area
Home Values in the Area
Average Home Value in this Area
Purchase History
| Date | Buyer | Sale Price | Title Company |
|---|---|---|---|
| Hahn Dinan Llc | -- | Pacific Northwest Title | |
| Cook Properties Llc | -- | None Available | |
| Cook David J | $450,000 | Stewart Title Of Kitsap | |
| Kass Kent E | $165,000 | Transnation Title Ins |
Source: Public Records
Mortgage History
| Date | Status | Borrower | Loan Amount |
|---|---|---|---|
| Previous Owner | Cook David J | $734,000 | |
| Previous Owner | Kass Kent E | $135,000 |
Source: Public Records
Tax History Compared to Growth
Tax History
| Year | Tax Paid | Tax Assessment Tax Assessment Total Assessment is a certain percentage of the fair market value that is determined by local assessors to be the total taxable value of land and additions on the property. | Land | Improvement |
|---|---|---|---|---|
| 2026 | $8,176 | $975,790 | $709,070 | $266,720 |
| 2025 | $8,176 | $975,790 | $709,070 | $266,720 |
| 2024 | $7,127 | $884,150 | $545,430 | $338,720 |
| 2023 | $7,298 | $869,600 | $519,440 | $350,160 |
| 2022 | $7,754 | $794,130 | $519,440 | $274,690 |
| 2021 | $7,957 | $779,700 | $493,680 | $286,020 |
| 2020 | $8,205 | $794,310 | $472,220 | $322,090 |
| 2019 | $7,844 | $773,910 | $472,220 | $301,690 |
| 2018 | $6,960 | $531,880 | $429,350 | $102,530 |
| 2017 | $5,747 | $531,880 | $429,350 | $102,530 |
| 2016 | $5,738 | $507,290 | $385,580 | $121,710 |
| 2015 | $4,668 | $430,180 | $308,470 | $121,710 |
| 2014 | -- | $385,600 | $269,910 | $115,690 |
| 2013 | -- | $473,730 | $358,040 | $115,690 |
Source: Public Records
Map
Nearby Homes
- 522 Madrona Way NE Unit 4
- 200 Shepard Way NW
- 224 Canopy Path NW
- 204 Shepard Way NW
- 392 Wills Ln NW
- 230 Canopy Path NW
- 214 Shepard Way NW
- 259 Shepard Way NW Unit 204
- 144 Hall Brothers Loop NW Unit 101
- 774 Madison Ave N Unit B774
- 620 NE Vineyard Ln Unit B302
- 752 NE Vineyard Ln Unit L205
- 171 Wallace Way NE Unit B
- 465 Winslow Way E Unit 108
- 610 NE Vineyard Ln Unit A104
- 141 Parfitt Way SW Unit A-35
- 141 Parfitt Way SW Unit M-10
- 300 High School Rd NE Unit 203
- 300 High School Rd NE Unit 419
- 1322 Polly's Ln
- 159 Wyatt Way NE
- 167 Wyatt Way NE
- 167 Wyatt Way NE
- 158 Madrona Way NE
- 127 Wyatt Way NE Unit 200
- 127 Wyatt Way NE Unit 208
- 127 Wyatt Way NE Unit 100
- 127 Wyatt Way NE Unit P2
- 127 Wyatt Way NE Unit 202
- 127 Wyatt Way NE Unit P5678
- 127 Wyatt Way NE Unit 206
- 127 Wyatt Way NE Unit 109
- 198 Madrona Way NE
- 156 Madrona Way NE
- 154 Madrona Way NE
- 186 Madrona Way NE
- 250 Madrona Way NE Unit 110
- 152 Madrona Way NE
- 250 Madrona Way NE Unit 110-B
- 250 Madrona Way NE Unit 110-A