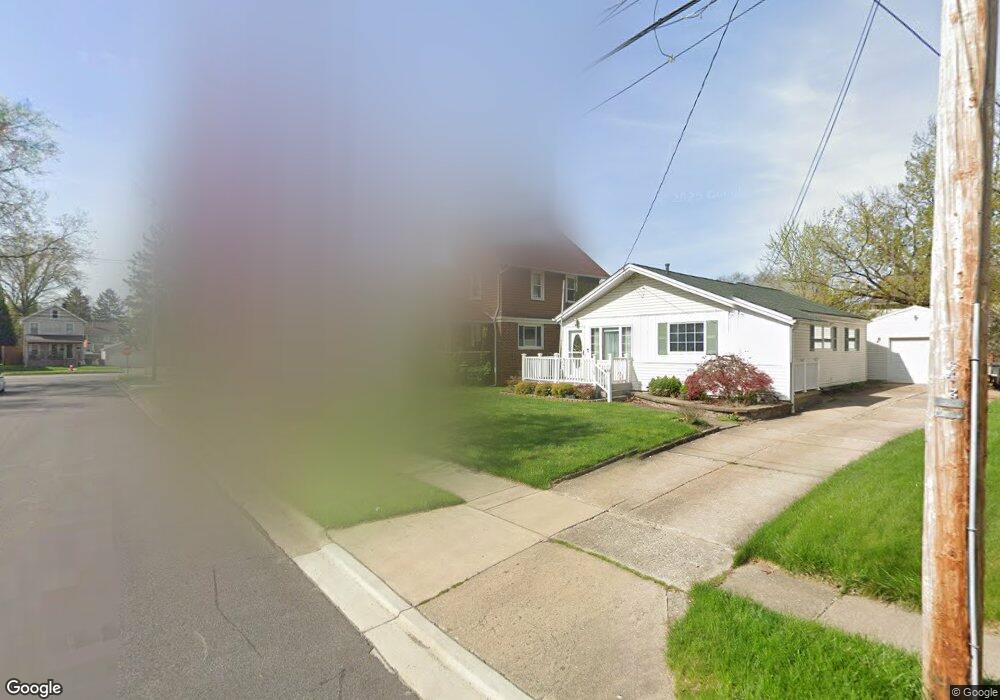
1630 10th St Cuyahoga Falls, OH 44221
Southeast Cuyahoga Falls NeighborhoodEstimated Value: $201,000 - $230,000
3
Beds
2
Baths
1,664
Sq Ft
$132/Sq Ft
Est. Value
About This Home
This home is located at 1630 10th St, Cuyahoga Falls, OH 44221 and is currently estimated at $219,074, approximately $131 per square foot. 1630 10th St is a home located in Summit County with nearby schools including Dewitt Elementary School, Bolich Middle School, and Cuyahoga Falls High School.
Ownership History
Date
Name
Owned For
Owner Type
Purchase Details
Closed on
Oct 12, 2023
Sold by
Dean Anthony F
Bought by
Dean Karen M
Current Estimated Value
Purchase Details
Closed on
Aug 7, 2002
Sold by
Obendorf Carl W and Obendorf Bonnie J
Bought by
Dean Anthony F and Dean Karen M
Home Financials for this Owner
Home Financials are based on the most recent Mortgage that was taken out on this home.
Original Mortgage
$120,510
Interest Rate
6.64%
Create a Home Valuation Report for This Property
The Home Valuation Report is an in-depth analysis detailing your home's value as well as a comparison with similar homes in the area
Home Values in the Area
Average Home Value in this Area
Purchase History
| Date | Buyer | Sale Price | Title Company |
|---|---|---|---|
| Dean Karen M | -- | None Listed On Document | |
| Dean Anthony F | $133,000 | Falls Title Agency Inc |
Source: Public Records
Mortgage History
| Date | Status | Borrower | Loan Amount |
|---|---|---|---|
| Previous Owner | Dean Anthony F | $120,510 |
Source: Public Records
Tax History Compared to Growth
Tax History
| Year | Tax Paid | Tax Assessment Tax Assessment Total Assessment is a certain percentage of the fair market value that is determined by local assessors to be the total taxable value of land and additions on the property. | Land | Improvement |
|---|---|---|---|---|
| 2025 | $3,266 | $60,495 | $9,055 | $51,440 |
| 2024 | $3,266 | $60,495 | $9,055 | $51,440 |
| 2023 | $3,266 | $60,495 | $9,055 | $51,440 |
| 2022 | $3,156 | $47,492 | $7,074 | $40,418 |
| 2021 | $3,156 | $47,492 | $7,074 | $40,418 |
| 2020 | $3,104 | $47,490 | $7,070 | $40,420 |
| 2019 | $2,796 | $38,950 | $7,000 | $31,950 |
| 2018 | $2,374 | $38,950 | $7,000 | $31,950 |
| 2017 | $2,132 | $38,950 | $7,000 | $31,950 |
| 2016 | $2,134 | $35,460 | $7,000 | $28,460 |
| 2015 | $2,132 | $35,460 | $7,000 | $28,460 |
| 2014 | $2,133 | $35,460 | $7,000 | $28,460 |
| 2013 | $2,115 | $35,460 | $7,000 | $28,460 |
Source: Public Records
Map
Nearby Homes