1630 East St Tracy, CA 95376
Tracy AreaEstimated Value: $383,328 - $444,000
About This Home
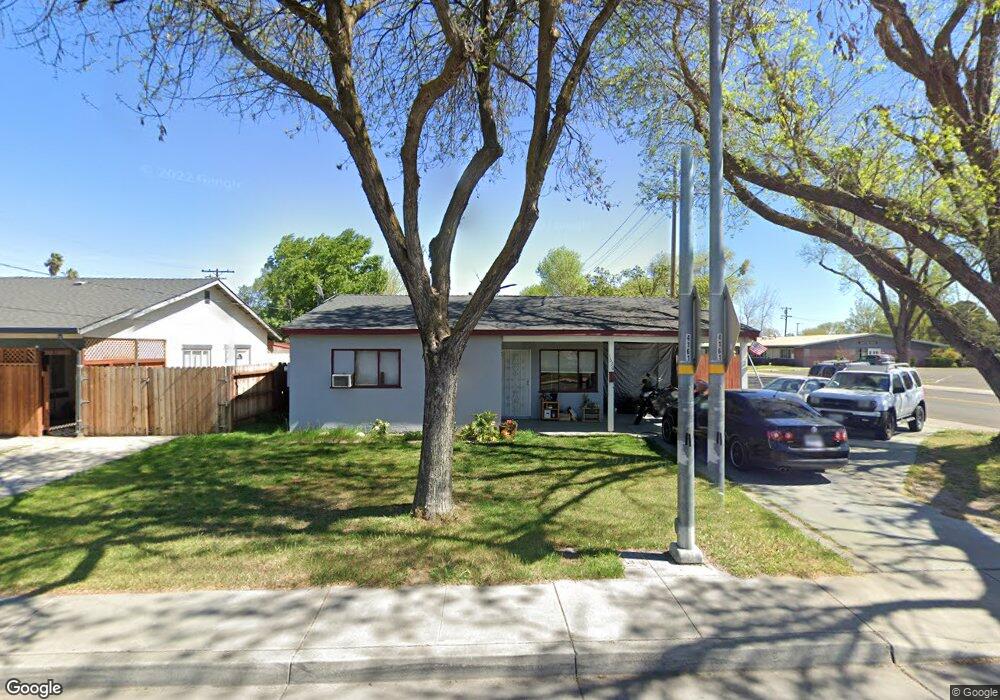
This home is located at 1630 East St, Tracy, CA 95376 and is currently estimated at $417,332, approximately $436 per square foot. 1630 East St is a home located in San Joaquin County with nearby schools including Central Elementary School, Tracy High School, and Primary Charter School.
Ownership History
We collect this data history from publicly available records. To have your information removed, we recommend requesting removal directly through your county’s website.
Purchase Details
Home Financials for this Owner
Home Financials are based on the most recent Mortgage that was taken out on this home.Home Values in the Area
Average Home Value in this Area
Purchase History
We collect this data history from publicly available records. To have your information removed, we recommend requesting removal directly through your county’s website.
| Date | Buyer | Sale Price | Title Company |
|---|---|---|---|
| -- | Accommodation |
Mortgage History
We collect this data history from publicly available records. To have your information removed, we recommend requesting removal directly through your county’s website.
| Date | Status | Borrower | Loan Amount |
|---|---|---|---|
| Closed | $138,400 | ||
| Closed | $166,000 | ||
| Closed | $147,000 | ||
| Closed | $110,000 | ||
| Closed | $60,000 |
Tax History
We collect this data history from publicly available records. To have your information removed, we recommend requesting removal directly through your county’s website.
| Year | Tax Paid | Tax Assessment Tax Assessment Total Assessment is a certain percentage of the fair market value that is determined by local assessors to be the total taxable value of land and additions on the property. | Land | Improvement |
|---|---|---|---|---|
| 2025 | $628 | $59,997 | $13,802 | $46,195 |
| 2024 | $578 | $58,822 | $13,532 | $45,290 |
| 2023 | $568 | $57,669 | $13,267 | $44,402 |
| 2022 | $554 | $56,539 | $13,007 | $43,532 |
| 2021 | $547 | $55,431 | $12,752 | $42,679 |
| 2020 | $542 | $54,864 | $12,622 | $42,242 |
| 2019 | $533 | $53,789 | $12,375 | $41,414 |
| 2018 | $522 | $52,735 | $12,133 | $40,602 |
| 2017 | $496 | $51,702 | $11,896 | $39,806 |
| 2016 | $500 | $50,688 | $11,663 | $39,025 |
| 2014 | $466 | $48,949 | $11,263 | $37,686 |
Map
- 124 E Lowell Ave
- 222 Pereira Ave
- 1360 East St
- 34 W Carlton Way
- 350 E 22nd St
- 111 E 21st St
- 180 E Grant Line Rd
- 360 E Grant Line Rd Unit 16
- 158 E Grant Line Rd
- 1320 Holly Dr
- 1458 Parker Ave
- 1719 Parker Ave
- 1434 Parker Ave
- 309 Portola Way
- 250 W 23rd St
- 173 Tracy Cir
- 2448 Altoga Ave
- 445 W Lowell Ave
- 1245 Parker Ave Unit 3
- 1243 Parker Ave Unit 2
- 1636 East St
- 1642 East St
- 311 Acacia St
- 314 E Lowell Ave
- 1648 East St
- 315 Acacia St
- 245 Acacia St
- 318 E Lowell Ave
- 256 E Lowell Ave
- 319 Acacia St
- 322 E Lowell Ave
- 239 Acacia St
- 246 E Lowell Ave
- 323 Acacia St
- 326 E Lowell Ave
- 309 E Lowell Ave
- 246 Acacia St
- 233 Acacia St
- 311 E Lowell Ave
- 327 Acacia St
Ask me questions while you tour the home.