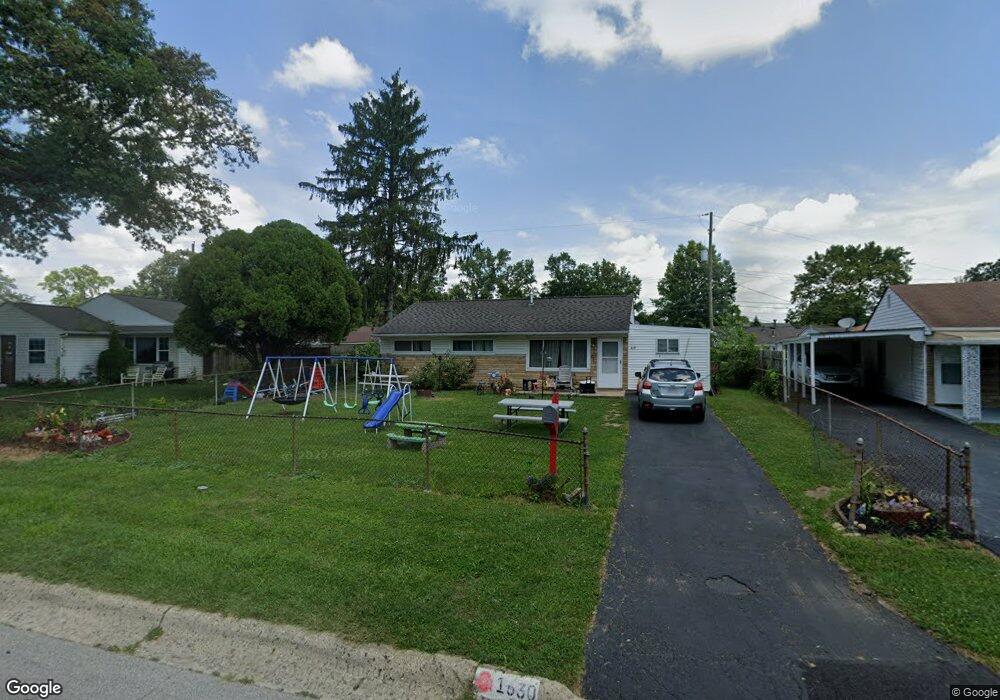
1630 Marsdale Ave Columbus, OH 43223
Estimated Value: $174,538 - $208,000
4
Beds
1
Bath
1,175
Sq Ft
$159/Sq Ft
Est. Value
About This Home
This home is located at 1630 Marsdale Ave, Columbus, OH 43223 and is currently estimated at $187,135, approximately $159 per square foot. 1630 Marsdale Ave is a home located in Franklin County with nearby schools including Finland Elementary School, Franklin Woods Intermediate School, and Finland Middle School.
Ownership History
Date
Name
Owned For
Owner Type
Purchase Details
Closed on
Jul 29, 1999
Sold by
Marvin Scott A
Bought by
Logan Jason W and Logan Terra L
Current Estimated Value
Home Financials for this Owner
Home Financials are based on the most recent Mortgage that was taken out on this home.
Original Mortgage
$68,594
Outstanding Balance
$19,773
Interest Rate
7.69%
Mortgage Type
FHA
Estimated Equity
$167,362
Purchase Details
Closed on
Jun 2, 1998
Sold by
Home Investors Inc
Bought by
Marvin Scott A
Home Financials for this Owner
Home Financials are based on the most recent Mortgage that was taken out on this home.
Original Mortgage
$56,350
Interest Rate
7.27%
Mortgage Type
FHA
Purchase Details
Closed on
Sep 25, 1995
Sold by
Walls Ronald L and Glenfed Mtg Corp
Bought by
Home Investors Inc
Purchase Details
Closed on
Apr 1, 1987
Create a Home Valuation Report for This Property
The Home Valuation Report is an in-depth analysis detailing your home's value as well as a comparison with similar homes in the area
Home Values in the Area
Average Home Value in this Area
Purchase History
| Date | Buyer | Sale Price | Title Company |
|---|---|---|---|
| Logan Jason W | $69,500 | Connor Title Co | |
| Marvin Scott A | $41,300 | -- | |
| Home Investors Inc | $38,800 | -- | |
| -- | $43,000 | -- |
Source: Public Records
Mortgage History
| Date | Status | Borrower | Loan Amount |
|---|---|---|---|
| Open | Logan Jason W | $68,594 | |
| Closed | Marvin Scott A | $56,350 |
Source: Public Records
Tax History Compared to Growth
Tax History
| Year | Tax Paid | Tax Assessment Tax Assessment Total Assessment is a certain percentage of the fair market value that is determined by local assessors to be the total taxable value of land and additions on the property. | Land | Improvement |
|---|---|---|---|---|
| 2024 | $2,485 | $48,720 | $7,840 | $40,880 |
| 2023 | $2,472 | $48,720 | $7,840 | $40,880 |
| 2022 | $1,743 | $23,630 | $8,890 | $14,740 |
| 2021 | $1,656 | $23,630 | $8,890 | $14,740 |
| 2020 | $1,653 | $23,630 | $8,890 | $14,740 |
| 2019 | $1,524 | $19,530 | $7,420 | $12,110 |
| 2018 | $1,497 | $19,530 | $7,420 | $12,110 |
| 2017 | $1,550 | $19,530 | $7,420 | $12,110 |
| 2016 | $1,590 | $19,290 | $3,330 | $15,960 |
| 2015 | $1,476 | $19,290 | $3,330 | $15,960 |
| 2014 | $1,477 | $19,290 | $3,330 | $15,960 |
| 2013 | $854 | $22,715 | $3,920 | $18,795 |
Source: Public Records
Map
Nearby Homes
- 1417 Fahy Dr
- 1390 Gray Meadow Dr
- 1723 Farberdale Dr
- 1659 Westmeadow Dr
- 1607 Red Leaf Ln
- 1543 Red Leaf Ln
- 1532 Westmeadow Dr
- 2210 October Ridge Dr
- 1948 Big Run Bluffs Blvd
- 1949 Big Run Bluffs Blvd
- 1417 Brown Rd
- 1994 Little Ave
- 1663 Hopkins Ave
- 1540 Little Ave
- 0 S Central Ave
- 1757 Linnet Ave
- 1969 Forest Lake Ct
- 2436 Onyx Ct
- 1258 Woodbrook Cir W Unit 199
- 2180 Eakin Rd
- 1638 Marsdale Ave
- 1624 Marsdale Ave
- 1447 Marsdale Ave
- 1625 Eastfield Dr N
- 1633 Eastfield Dr N
- 1613 Eastfield Dr N
- 1646 Marsdale Ave
- 1618 Marsdale Ave
- 1641 Eastfield Dr N
- 1639 Marsdale Ave
- 1607 Eastfield Dr N
- 1652 Marsdale Ave
- 1627 Eastbrook Dr S
- 1612 Marsdale Ave
- 1647 Eastfield Dr N
- 1649 Marsdale Ave
- 1644 Eastbrook Dr S
- 1660 Marsdale Ave
- 1622 Eastfield Dr N
- 1616 Eastfield Dr N