Estimated Value: $191,510 - $210,000
3
Beds
1
Bath
1,276
Sq Ft
$157/Sq Ft
Est. Value
About This Home
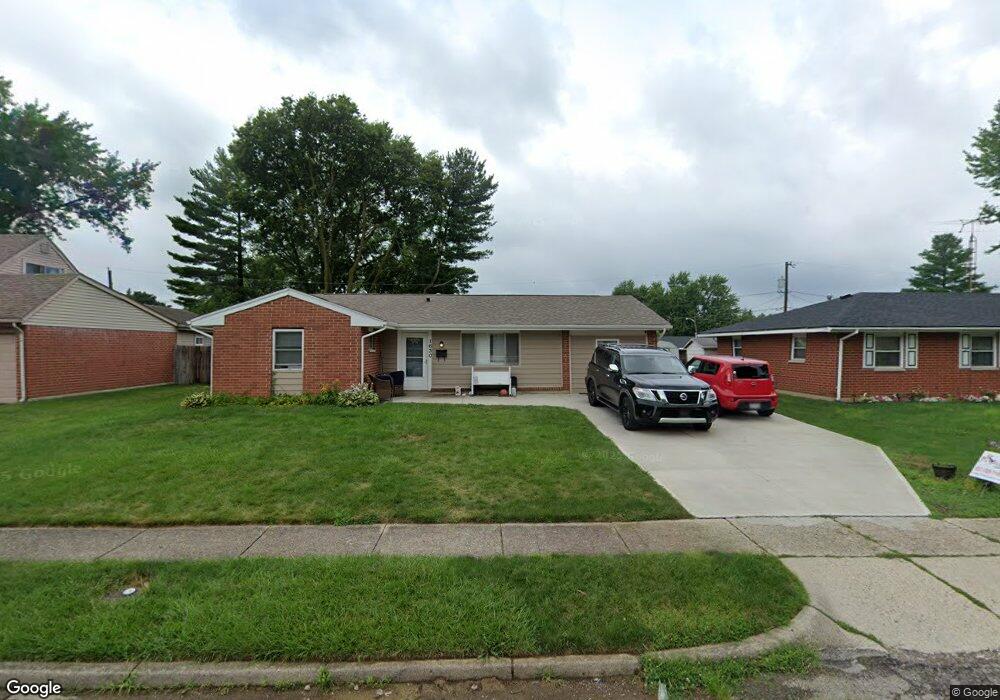
This home is located at 1630 Navajo Dr, Xenia, OH 45385 and is currently estimated at $200,878, approximately $157 per square foot. 1630 Navajo Dr is a home located in Greene County with nearby schools including Xenia High School, Summit Academy Community School for Alternative Learners - Xenia, and Legacy Christian Academy.
Ownership History
Date
Name
Owned For
Owner Type
Purchase Details
Closed on
Apr 12, 2007
Sold by
Hud
Bought by
Angel Pedro G and Angel Stephanie M
Current Estimated Value
Home Financials for this Owner
Home Financials are based on the most recent Mortgage that was taken out on this home.
Original Mortgage
$68,500
Outstanding Balance
$41,531
Interest Rate
6.2%
Mortgage Type
Unknown
Estimated Equity
$159,347
Purchase Details
Closed on
Aug 10, 2006
Sold by
Spin Daniel I and Spin Billie J
Bought by
Hud
Purchase Details
Closed on
Apr 5, 1999
Sold by
Lester Julia B and Lester Julia Bell
Bought by
Spin Daniel I and Spin Billie J
Home Financials for this Owner
Home Financials are based on the most recent Mortgage that was taken out on this home.
Original Mortgage
$72,485
Interest Rate
6.94%
Mortgage Type
FHA
Purchase Details
Closed on
May 2, 1997
Sold by
Lester Julia B
Bought by
Bill and Gambrel Betty
Create a Home Valuation Report for This Property
The Home Valuation Report is an in-depth analysis detailing your home's value as well as a comparison with similar homes in the area
Home Values in the Area
Average Home Value in this Area
Purchase History
| Date | Buyer | Sale Price | Title Company |
|---|---|---|---|
| Angel Pedro G | $68,500 | Lakeside Title & Escrow Agen | |
| Hud | $55,000 | None Available | |
| Spin Daniel I | $72,900 | -- | |
| Bill | $70,000 | -- |
Source: Public Records
Mortgage History
| Date | Status | Borrower | Loan Amount |
|---|---|---|---|
| Open | Angel Pedro G | $68,500 | |
| Previous Owner | Spin Daniel I | $72,485 | |
| Closed | Bill | $0 |
Source: Public Records
Tax History Compared to Growth
Tax History
| Year | Tax Paid | Tax Assessment Tax Assessment Total Assessment is a certain percentage of the fair market value that is determined by local assessors to be the total taxable value of land and additions on the property. | Land | Improvement |
|---|---|---|---|---|
| 2024 | $2,023 | $47,280 | $11,500 | $35,780 |
| 2023 | $2,023 | $47,280 | $11,500 | $35,780 |
| 2022 | $1,675 | $33,390 | $6,770 | $26,620 |
| 2021 | $1,698 | $33,390 | $6,770 | $26,620 |
| 2020 | $1,626 | $33,390 | $6,770 | $26,620 |
| 2019 | $1,236 | $23,890 | $6,500 | $17,390 |
| 2018 | $1,241 | $23,890 | $6,500 | $17,390 |
| 2017 | $1,127 | $23,890 | $6,500 | $17,390 |
| 2016 | $1,127 | $21,290 | $6,500 | $14,790 |
| 2015 | $1,130 | $21,290 | $6,500 | $14,790 |
| 2014 | $1,082 | $21,290 | $6,500 | $14,790 |
Source: Public Records
Map
Nearby Homes
- 1618 Navajo Dr
- 1653 Seneca Dr
- 1568 Cheyenne Dr
- 1778 Arapaho Dr
- 1769 Gayhart Dr
- 1144 Rockwell Dr
- 2758 Wyoming Dr
- 1829 Gayhart Dr
- 1272 Bellbrook Ave
- 161 Montana Dr
- 1208 Bellbrook Ave
- 1866 Roxbury Dr
- 219 Kansas Dr
- 1908 Whitt St
- 2142 Michigan Dr
- 414 Whisper Ln
- 121 S Progress Dr
- 1342 Kylemore Dr
- 1255 Colorado Dr
- 2257 Maryland Dr