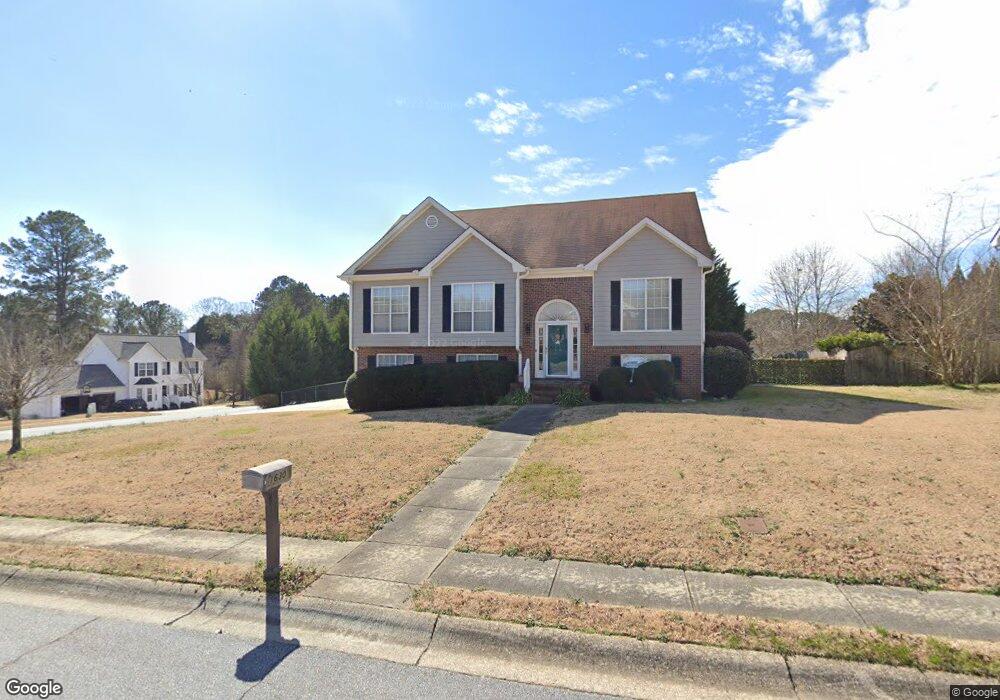
1630 Rose Pointe Dr Loganville, GA 30052
Estimated Value: $378,000 - $401,000
4
Beds
3
Baths
2,494
Sq Ft
$156/Sq Ft
Est. Value
About This Home
This home is located at 1630 Rose Pointe Dr, Loganville, GA 30052 and is currently estimated at $389,379, approximately $156 per square foot. 1630 Rose Pointe Dr is a home located in Gwinnett County with nearby schools including Magill Elementary School, Grace Snell Middle School, and South Gwinnett High School.
Ownership History
Date
Name
Owned For
Owner Type
Purchase Details
Closed on
Jun 15, 2022
Sold by
Helton Sheena
Bought by
Mch Sfr Property Owner 4 Llc
Current Estimated Value
Purchase Details
Closed on
Sep 11, 2017
Sold by
Maloy Sheena Lee
Bought by
Maloy Sheena Lee and Helton Steven G
Home Financials for this Owner
Home Financials are based on the most recent Mortgage that was taken out on this home.
Original Mortgage
$126,000
Interest Rate
3.9%
Mortgage Type
New Conventional
Purchase Details
Closed on
Aug 8, 2014
Sold by
Maloy Justin Christopher
Bought by
Maloy Sheena Lee
Purchase Details
Closed on
Nov 18, 2011
Sold by
Your Home Solutions Llc
Bought by
Maloy Justin Christopher and Maloy Sheena Lee
Home Financials for this Owner
Home Financials are based on the most recent Mortgage that was taken out on this home.
Original Mortgage
$102,338
Interest Rate
4.12%
Mortgage Type
FHA
Purchase Details
Closed on
Oct 27, 1993
Sold by
Perimeter Inv Group
Bought by
Hill Leonard N Melanie
Create a Home Valuation Report for This Property
The Home Valuation Report is an in-depth analysis detailing your home's value as well as a comparison with similar homes in the area
Home Values in the Area
Average Home Value in this Area
Purchase History
| Date | Buyer | Sale Price | Title Company |
|---|---|---|---|
| Mch Sfr Property Owner 4 Llc | $365,500 | -- | |
| Maloy Sheena Lee | -- | -- | |
| Maloy Sheena Lee | -- | -- | |
| Maloy Justin Christopher | $105,000 | -- | |
| Hill Leonard N Melanie | $103,600 | -- |
Source: Public Records
Mortgage History
| Date | Status | Borrower | Loan Amount |
|---|---|---|---|
| Previous Owner | Maloy Sheena Lee | $126,000 | |
| Previous Owner | Maloy Justin Christopher | $102,338 | |
| Closed | Hill Leonard N Melanie | -- |
Source: Public Records
Tax History Compared to Growth
Tax History
| Year | Tax Paid | Tax Assessment Tax Assessment Total Assessment is a certain percentage of the fair market value that is determined by local assessors to be the total taxable value of land and additions on the property. | Land | Improvement |
|---|---|---|---|---|
| 2024 | $5,250 | $138,240 | $30,000 | $108,240 |
| 2023 | $5,250 | $146,000 | $29,680 | $116,320 |
| 2022 | $3,638 | $131,520 | $20,000 | $111,520 |
| 2021 | $2,951 | $95,880 | $16,000 | $79,880 |
| 2020 | $2,854 | $90,440 | $14,000 | $76,440 |
| 2019 | $2,346 | $70,000 | $9,600 | $60,400 |
| 2018 | $2,345 | $70,000 | $9,600 | $60,400 |
| 2016 | $1,920 | $52,000 | $9,600 | $42,400 |
| 2015 | $1,941 | $52,000 | $9,600 | $42,400 |
| 2014 | $1,950 | $52,000 | $9,600 | $42,400 |
Source: Public Records
Map
Nearby Homes
- 1350 Summer Lake Terrace
- 1471 Stephens View Dr
- 3614 Squires Park Ln
- 3725 Heron Creek Ct
- 3604 Squires Park Ln
- 3623 Squires Park Ln
- 1371 Stephens View Dr
- 1361 Stephens View Dr
- 1370 Compton Woods Dr
- 1385 Compton Woods Dr
- 3715 Heron Creek Ct
- 3705 Heron Creek Ct
- 4444 Kendrick Cir
- 3590 Stephens Creek Place Unit 1
- 609 Blue Juniper Cir
- 629 Blue Juniper Cir
- 1649 Hay Patch Ln
- 1670 Rose Garden Ln
- 1630 Rose Pointe Dr
- 1640 Rose Pointe Dr
- 1570 Rose Pointe Dr
- 1635 Rose Pointe Dr
- 1645 Rose Pointe Dr
- 1650 Rose Pointe Dr
- 1605 Rose Pointe Dr
- 1645 Rose Pointe Dr Unit 11
- 1645 Rose Pointe Dr
- 1645 Rose Pointe Dr
- 1595 Rose Pointe Dr
- 1625 Rose Pointe Dr
- 1585 Rose Pointe Dr
- 1575 Rose Pointe Dr
- 1615 Rose Pointe Dr
- 1655 Rose Pointe Dr
- 3700 Frankie Wade Ln
- 1660 Rose Pointe Dr
- 1550 Rose Pointe Dr
- 1565 Rose Pointe Dr