
Seller's Agent in 2021
Steven Pinza
(510) 725-4775
5 in this area
87 Total Sales
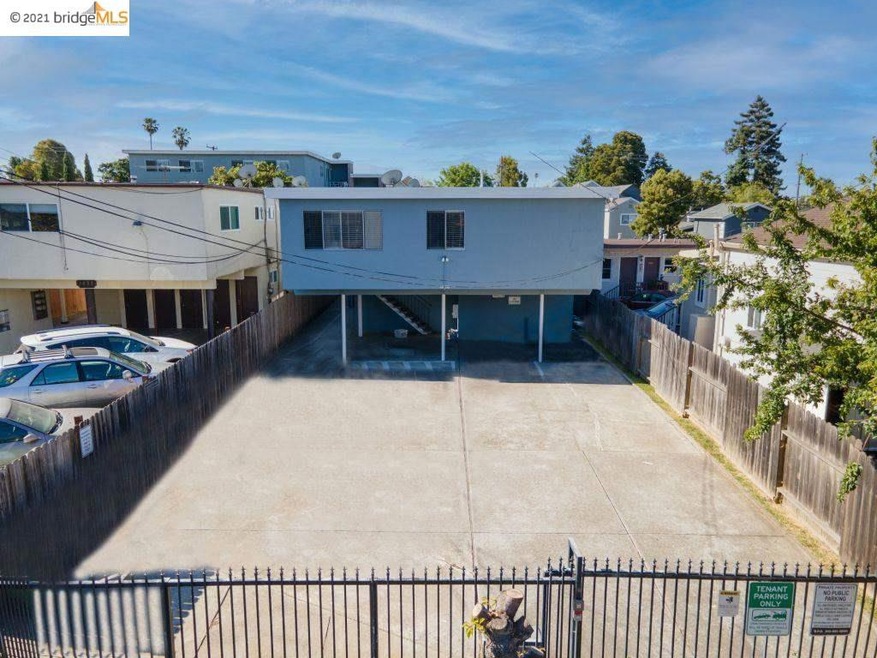
Five Units With a Great Unit Mix Comprised of Two 2bd/1bth Units and Three 1bd/1bth Units; Separate For PG&E, Low Water & Garbage Costs, and Fresh Exterior Paint; Onsite Coin-Operated Laundry Facility, Large Unit Layouts; Private & Automatic Security Gate; One Unit Delivered Vacant & Significant Rental Upside Upon Turnover, Buyouts or Gradual Rent Increases; 5.45% Current Cap & 12.56 Current GRM; Email Agent For Complete Marketing Package
| Date | Event | Price | List to Sale | Price per Sq Ft |
|---|---|---|---|---|
| 02/04/2025 02/04/25 | Off Market | $1,325,000 | -- | -- |
| 12/15/2021 12/15/21 | Sold | $1,325,000 | -5.0% | $322 / Sq Ft |
| 09/01/2021 09/01/21 | Pending | -- | -- | -- |
| 08/24/2021 08/24/21 | Price Changed | $1,395,000 | -6.7% | $339 / Sq Ft |
| 07/09/2021 07/09/21 | For Sale | $1,495,000 | -- | $363 / Sq Ft |
| Year | Tax Paid | Tax Assessment Tax Assessment Total Assessment is a certain percentage of the fair market value that is determined by local assessors to be the total taxable value of land and additions on the property. | Land | Improvement |
|---|---|---|---|---|
| 2025 | $22,613 | $1,403,437 | $530,600 | $872,837 |
| 2024 | $22,613 | $1,375,929 | $520,200 | $855,729 |
| 2023 | $22,135 | $1,348,950 | $510,000 | $838,950 |
| 2022 | $21,714 | $1,322,500 | $500,000 | $822,500 |
| 2021 | $19,069 | $1,013,219 | $428,876 | $584,343 |
| 2020 | $30,325 | $1,002,834 | $424,480 | $578,354 |
| 2019 | $25,793 | $983,178 | $416,160 | $567,018 |
| 2018 | $17,743 | $963,900 | $408,000 | $555,900 |
| 2017 | $16,660 | $945,000 | $400,000 | $545,000 |
| 2016 | $4,840 | $110,806 | $42,044 | $68,762 |
| 2015 | $4,744 | $109,142 | $41,413 | $67,729 |
| 2014 | $4,977 | $107,003 | $40,601 | $66,402 |
Seller's Agent in 2021
Steven Pinza
(510) 725-4775
5 in this area
87 Total Sales
Source: bridgeMLS
MLS Number: 40957999
Disclaimer: Certain information contained herein is derived from information provided by parties other than Homes.com. All information provided is deemed reliable, but is not guaranteed to be accurate and should be independently verified.
![]() Bay East 2026. CCAR 2026. bridgeMLS 2026. Information Deemed Reliable But Not Guaranteed. This information is being provided by the Bay East MLS, or CCAR MLS, or bridgeMLS. The listings presented here may or may not be listed by the Broker/Agent operating this website. This information is intended for the personal use of consumers and may not be used for any purpose other than to identify prospective properties consumers may be interested in purchasing.
Bay East 2026. CCAR 2026. bridgeMLS 2026. Information Deemed Reliable But Not Guaranteed. This information is being provided by the Bay East MLS, or CCAR MLS, or bridgeMLS. The listings presented here may or may not be listed by the Broker/Agent operating this website. This information is intended for the personal use of consumers and may not be used for any purpose other than to identify prospective properties consumers may be interested in purchasing.
Ask me questions while you tour the home.