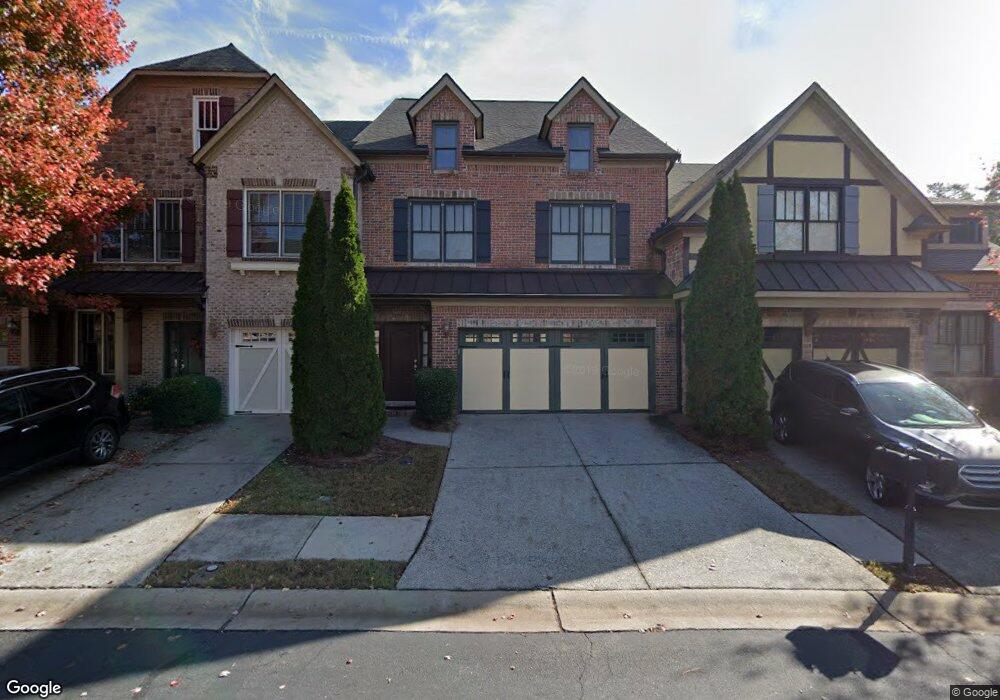
1630 Township Cir Unit 83 Alpharetta, GA 30004
Estimated Value: $456,000 - $486,000
3
Beds
3
Baths
1,935
Sq Ft
$244/Sq Ft
Est. Value
About This Home
This home is located at 1630 Township Cir Unit 83, Alpharetta, GA 30004 and is currently estimated at $472,471, approximately $244 per square foot. 1630 Township Cir Unit 83 is a home located in Forsyth County with nearby schools including Brandywine Elementary School, DeSana Middle School, and Denmark High School.
Ownership History
Date
Name
Owned For
Owner Type
Purchase Details
Closed on
Feb 9, 2024
Sold by
Hepp Dillon M and Hepp Katherine Glynn
Bought by
Rees Tyler William and Rees Audrey Katherine
Current Estimated Value
Home Financials for this Owner
Home Financials are based on the most recent Mortgage that was taken out on this home.
Original Mortgage
$458,810
Outstanding Balance
$450,702
Interest Rate
6.61%
Mortgage Type
New Conventional
Estimated Equity
$21,769
Purchase Details
Closed on
Jul 9, 2021
Sold by
Miracle Kevin
Bought by
Head Katherine G and Hepp Dillon M
Home Financials for this Owner
Home Financials are based on the most recent Mortgage that was taken out on this home.
Original Mortgage
$332,225
Interest Rate
2.9%
Mortgage Type
New Conventional
Purchase Details
Closed on
Apr 30, 2009
Sold by
Venture Homes Inc
Bought by
Miracle Kevin
Home Financials for this Owner
Home Financials are based on the most recent Mortgage that was taken out on this home.
Original Mortgage
$184,594
Interest Rate
4.86%
Mortgage Type
FHA
Create a Home Valuation Report for This Property
The Home Valuation Report is an in-depth analysis detailing your home's value as well as a comparison with similar homes in the area
Home Values in the Area
Average Home Value in this Area
Purchase History
| Date | Buyer | Sale Price | Title Company |
|---|---|---|---|
| Rees Tyler William | $473,000 | None Listed On Document | |
| Head Katherine G | $342,500 | -- | |
| Miracle Kevin | $188,000 | -- |
Source: Public Records
Mortgage History
| Date | Status | Borrower | Loan Amount |
|---|---|---|---|
| Open | Rees Tyler William | $458,810 | |
| Previous Owner | Head Katherine G | $332,225 | |
| Previous Owner | Miracle Kevin | $184,594 |
Source: Public Records
Tax History Compared to Growth
Tax History
| Year | Tax Paid | Tax Assessment Tax Assessment Total Assessment is a certain percentage of the fair market value that is determined by local assessors to be the total taxable value of land and additions on the property. | Land | Improvement |
|---|---|---|---|---|
| 2025 | $3,793 | $181,356 | $78,000 | $103,356 |
| 2024 | $3,793 | $178,008 | $66,000 | $112,008 |
| 2023 | $3,285 | $169,620 | $56,000 | $113,620 |
| 2022 | $3,266 | $111,752 | $40,000 | $71,752 |
| 2021 | $3,086 | $111,752 | $40,000 | $71,752 |
| 2020 | $2,981 | $107,964 | $40,000 | $67,964 |
| 2019 | $2,970 | $107,412 | $40,000 | $67,412 |
| 2018 | $2,860 | $103,424 | $32,000 | $71,424 |
| 2017 | $2,704 | $97,412 | $32,000 | $65,412 |
| 2016 | $2,243 | $80,812 | $24,000 | $56,812 |
| 2015 | $1,954 | $70,292 | $16,000 | $54,292 |
| 2014 | $1,695 | $64,024 | $0 | $0 |
Source: Public Records
Map
Nearby Homes
- 1550 Township Cir
- 419 Grayson Way
- 368 Grayson Way
- 472 Grayson Way
- 353 Grayson Way
- 409 Windstone Trail
- 406 Weatherstone Place
- 255 White Pines Dr
- 1615 Waverly Glen Dr
- 1480 Waverly Glen Dr
- 1620 Woodall View Ct
- 5512 Atlanta Hwy
- 785 Streamview Way
- 1345 Faircrest Ln
- 1255 Faircrest Crossing Dr
- 1245 Overland Crossing
- 5880 Atlanta Hwy
- 1405 Overland Crossing
- 5878 Atlanta Hwy
- 1630 Township Cir
- 1640 Township Cir Unit 1640
- 1640 Township Cir
- 1620 Township Cir
- 1620 Township Cir Unit 1620
- 1650 Township Cir
- 1610 Township Cir Unit 81
- 1610 Township Cir
- 1610 Township Cir Unit 1610
- 1625 Township Cir
- 1635 Township Cir
- 1635 Township Cir Unit 95
- 1615 Township Cir
- 1660 Township Cir
- 1645 Township Cir
- 0 Chesil St
- 1655 Township Cir
- 1610 Chesil St
- 1630 Chesil St
- 1630 Chesil St Unit 1630