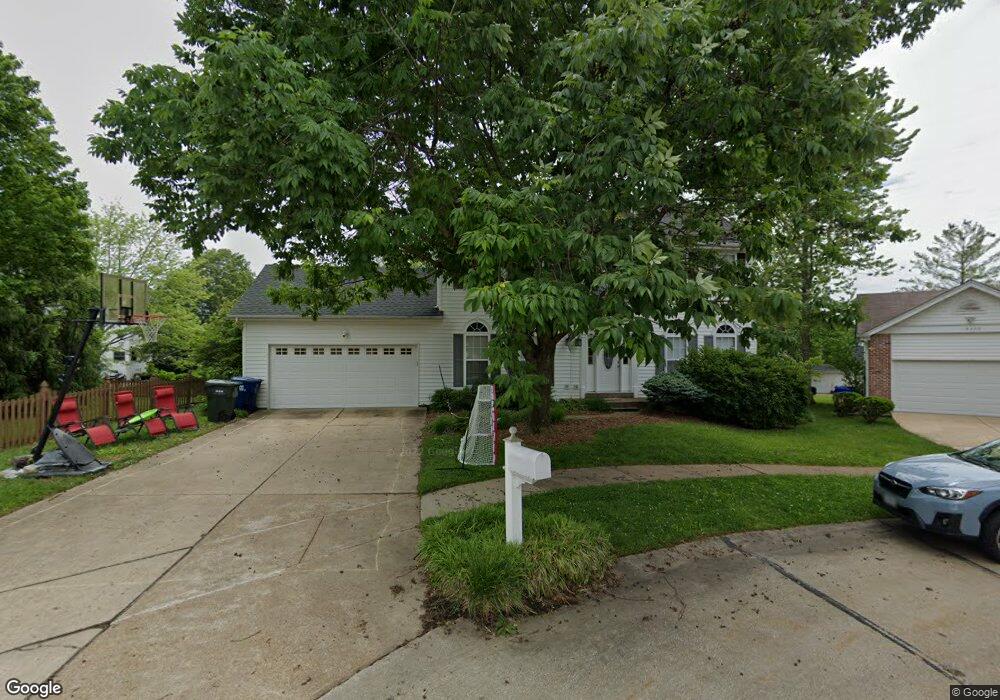
16304 Sunset Pointe Ct Grover, MO 63040
Estimated Value: $479,000 - $501,000
4
Beds
4
Baths
2,528
Sq Ft
$195/Sq Ft
Est. Value
About This Home
This home is located at 16304 Sunset Pointe Ct, Grover, MO 63040 and is currently estimated at $491,965, approximately $194 per square foot. 16304 Sunset Pointe Ct is a home located in St. Louis County with nearby schools including Fairway Elementary School, Wildwood Middle School, and Eureka Senior High School.
Ownership History
Date
Name
Owned For
Owner Type
Purchase Details
Closed on
Jul 26, 2012
Sold by
Leach Dennis J and Leach Stephanie M
Bought by
Ruzicka Christopher F and Ruzicka Tamara M
Current Estimated Value
Home Financials for this Owner
Home Financials are based on the most recent Mortgage that was taken out on this home.
Original Mortgage
$295,746
Outstanding Balance
$201,306
Interest Rate
3.68%
Mortgage Type
New Conventional
Estimated Equity
$290,659
Purchase Details
Closed on
Feb 23, 2006
Sold by
Glazer Matthew Todd and Glazer Diane Jabczenski
Bought by
Leach Dennis J and Leach Stephanie M
Home Financials for this Owner
Home Financials are based on the most recent Mortgage that was taken out on this home.
Original Mortgage
$55,600
Interest Rate
5.63%
Mortgage Type
Stand Alone Second
Create a Home Valuation Report for This Property
The Home Valuation Report is an in-depth analysis detailing your home's value as well as a comparison with similar homes in the area
Home Values in the Area
Average Home Value in this Area
Purchase History
We collect this data history from publicly available records. To have your information removed, we recommend requesting removal directly through your county’s website.
| Date | Buyer | Sale Price | Title Company |
|---|---|---|---|
| Ruzicka Christopher F | $325,000 | Investors Title Co Clayton | |
| Leach Dennis J | $278,000 | Touchstone Title & Abstract |
Source: Public Records
Mortgage History
We collect this data history from publicly available records. To have your information removed, we recommend requesting removal directly through your county’s website.
| Date | Status | Borrower | Loan Amount |
|---|---|---|---|
| Open | Ruzicka Christopher F | $295,746 | |
| Previous Owner | Leach Dennis J | $55,600 | |
| Previous Owner | Leach Dennis J | $222,400 |
Source: Public Records
Tax History
| Year | Tax Paid | Tax Assessment Tax Assessment Total Assessment is a certain percentage of the fair market value that is determined by local assessors to be the total taxable value of land and additions on the property. | Land | Improvement |
|---|---|---|---|---|
| 2025 | $5,623 | $82,650 | $27,300 | $55,350 |
| 2024 | $5,623 | $80,860 | $17,060 | $63,800 |
| 2023 | $5,618 | $80,860 | $17,060 | $63,800 |
| 2022 | $5,306 | $70,930 | $17,060 | $53,870 |
| 2021 | $5,267 | $70,930 | $17,060 | $53,870 |
| 2020 | $5,095 | $65,420 | $15,350 | $50,070 |
| 2019 | $5,115 | $65,420 | $15,350 | $50,070 |
| 2018 | $4,518 | $54,490 | $10,240 | $44,250 |
| 2017 | $4,411 | $54,490 | $10,240 | $44,250 |
| 2016 | $4,676 | $55,560 | $10,240 | $45,320 |
| 2015 | $4,581 | $55,560 | $10,240 | $45,320 |
| 2014 | $4,515 | $53,410 | $8,930 | $44,480 |
Source: Public Records
Map
Nearby Homes
- 350 Harbour Pointe Dr
- 16112 Ridgewoods Manor Cir
- 724 Lakeshore Meadows Dr
- 16117 Copper Ridge Ct
- 332 Waterside Dr Unit E22
- 16130 Port of Nantucket Dr
- 16124 Sea Breeze Ct
- 164 Crestmont Cir
- 2 Sequoia at Regal Pines Enclave
- 2 Hermitage II at Regal Pines Enclave
- 16004 Cinderella Ct
- 16008 Cinderella Ct
- 2 Belmont at Regal Pines Meadows
- 2 Pin Oak at Regal Pines Enclave
- 16016 Cinderella Ct
- 2 Meadows
- 16028 Nantucket Meadows Dr
- 2 Maple Expanded at Regal Pines Enclave
- 2 Burlington at Regal Pines Meadows
- 2 Nottingham at Regal Pines Enclave
- 16308 Sunset Pointe Ct
- 209 Harbour Pointe Dr
- 16307 Copperwood Ln
- 16311 Copperwood Ln
- 16315 Copperwood Ln
- 16303 Copperwood Ln
- 16319 Copperwood Ln
- 16301 Sunset Pointe Ct
- 16305 Sunset Pointe Ct
- 16309 Sunset Pointe Ct
- 16327 Copperwood Ln
- 208 Harbour Pointe Dr
- 212 Harbour Pointe Dr
- 204 Harbour Pointe Dr
- 16331 Copperwood Ln
- 216 Harbour Pointe Dr
- 120 Sail Port Ct
- 225 Harbour Pointe Dr
- 117 Sail Port Ct
- 206 Bayside Ct
Your Personal Tour Guide
Ask me questions while you tour the home.