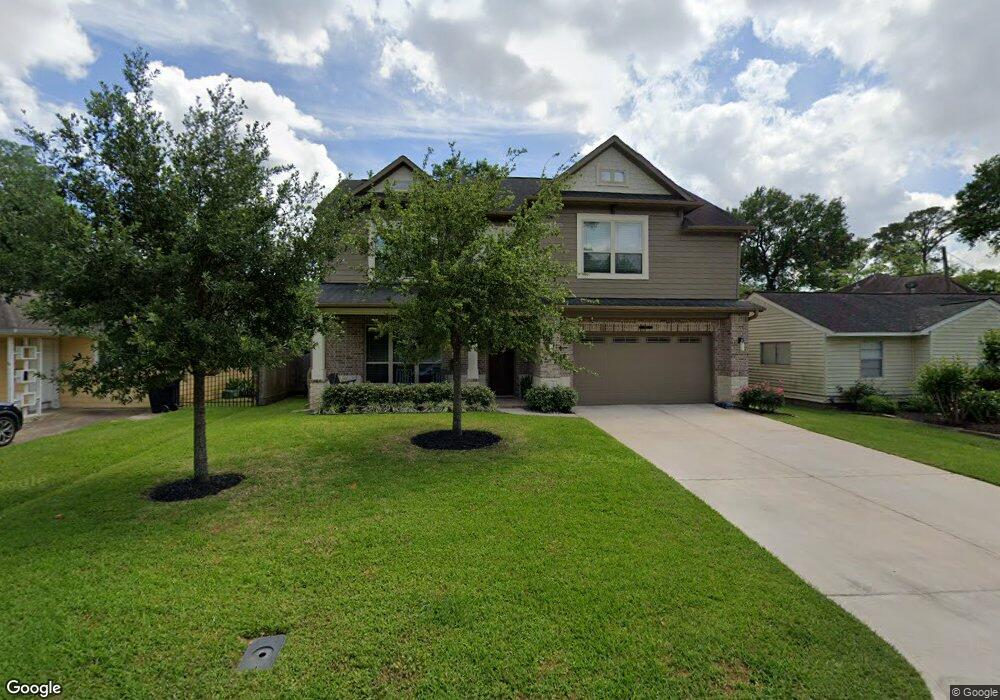
1631 Candlelight Ln Houston, TX 77018
Oak Forest-Garden Oaks NeighborhoodEstimated Value: $1,434,000 - $1,645,000
4
Beds
4
Baths
4,130
Sq Ft
$363/Sq Ft
Est. Value
About This Home
This home is located at 1631 Candlelight Ln, Houston, TX 77018 and is currently estimated at $1,501,195, approximately $363 per square foot. 1631 Candlelight Ln is a home located in Harris County with nearby schools including Oak Forest Elementary School, Frank Black Middle School, and Waltrip High School.
Ownership History
Date
Name
Owned For
Owner Type
Purchase Details
Closed on
Aug 19, 2016
Sold by
Legend Classic Homes Llc
Bought by
Correa Manuel R and Correa Nancy P
Current Estimated Value
Home Financials for this Owner
Home Financials are based on the most recent Mortgage that was taken out on this home.
Original Mortgage
$590,000
Outstanding Balance
$470,295
Interest Rate
3.45%
Mortgage Type
New Conventional
Estimated Equity
$1,030,900
Purchase Details
Closed on
Jun 21, 2013
Sold by
Rasco Investments Llc
Bought by
Legen Classic Homes Ltd
Purchase Details
Closed on
Aug 13, 2010
Sold by
Sample Holly V
Bought by
Rasco Investments Llc
Home Financials for this Owner
Home Financials are based on the most recent Mortgage that was taken out on this home.
Original Mortgage
$270,000
Interest Rate
4.55%
Mortgage Type
Reverse Mortgage Home Equity Conversion Mortgage
Purchase Details
Closed on
Feb 20, 1998
Sold by
Sample Holly V and Sample Doris L
Bought by
Sample Holly and Sample Doris L
Create a Home Valuation Report for This Property
The Home Valuation Report is an in-depth analysis detailing your home's value as well as a comparison with similar homes in the area
Home Values in the Area
Average Home Value in this Area
Purchase History
| Date | Buyer | Sale Price | Title Company |
|---|---|---|---|
| Correa Manuel R | $590,000 | Lch Title Co | |
| Legen Classic Homes Ltd | -- | Lch Title Co | |
| Rasco Investments Llc | $171,937 | None Available | |
| Sample Holly | -- | Netco | |
| Sample Holly | -- | -- |
Source: Public Records
Mortgage History
| Date | Status | Borrower | Loan Amount |
|---|---|---|---|
| Open | Correa Manuel R | $590,000 | |
| Previous Owner | Sample Holly | $270,000 |
Source: Public Records
Tax History Compared to Growth
Tax History
| Year | Tax Paid | Tax Assessment Tax Assessment Total Assessment is a certain percentage of the fair market value that is determined by local assessors to be the total taxable value of land and additions on the property. | Land | Improvement |
|---|---|---|---|---|
| 2025 | $23,770 | $1,323,595 | $489,258 | $834,337 |
| 2024 | $23,770 | $1,488,518 | $489,258 | $999,260 |
| 2023 | $23,770 | $1,448,840 | $452,193 | $996,647 |
| 2022 | $26,173 | $1,228,889 | $415,128 | $813,761 |
| 2021 | $25,185 | $1,080,615 | $355,824 | $724,791 |
| 2020 | $23,866 | $1,103,375 | $333,585 | $769,790 |
| 2019 | $22,672 | $1,021,494 | $311,346 | $710,148 |
| 2018 | $20,577 | $814,500 | $296,520 | $517,980 |
| 2017 | $20,595 | $814,500 | $296,520 | $517,980 |
| 2016 | $16,439 | $650,118 | $296,520 | $353,598 |
| 2015 | -- | $403,080 | $259,455 | $143,625 |
| 2014 | -- | $237,216 | $237,216 | $0 |
Source: Public Records
Map
Nearby Homes
- 1611 Richelieu Ln
- 1634 Latexo Dr
- 1622 Candlelight Ln
- 1623 Latexo Dr
- 1402 Hewitt Dr
- 1519 Candlelight Ln
- 1522 Hewitt Dr
- 4410 Deer Lodge Dr
- 4411 Deer Lodge Dr
- 1419 Richelieu Ln
- 1839 Bethlehem St
- 4403 Sumner Dr
- 1514 Chantilly Ln
- 1802 Del Norte St Unit A
- 1802 Del Norte St Unit C
- 1804 Del Norte St Unit D
- 1804 Del Norte St Unit C
- 4902 Oak Forest Dr
- 1407 Martin St
- 4414 Lavell Dr
- 1627 Candlelight Ln
- 1635 Candlelight Ln
- 1623 Candlelight Ln
- 1636 Richelieu Ln
- 1630 Richelieu Ln
- 1642 Richelieu Ln
- 1626 Richelieu Ln
- 1639 Candlelight Ln
- 1622 Richelieu Ln
- 1619 Candlelight Ln
- 1630 Candlelight Ln
- 1634 Candlelight Ln
- 1626 Candlelight Ln
- 1618 Richelieu Ln
- 1638 Candlelight Ln
- 1615 Candlelight Ln
- 1642 Candlelight Ln
- 1614 Richelieu Ln
- 1618 Candlelight Ln
- 1611 Candlelight Ln