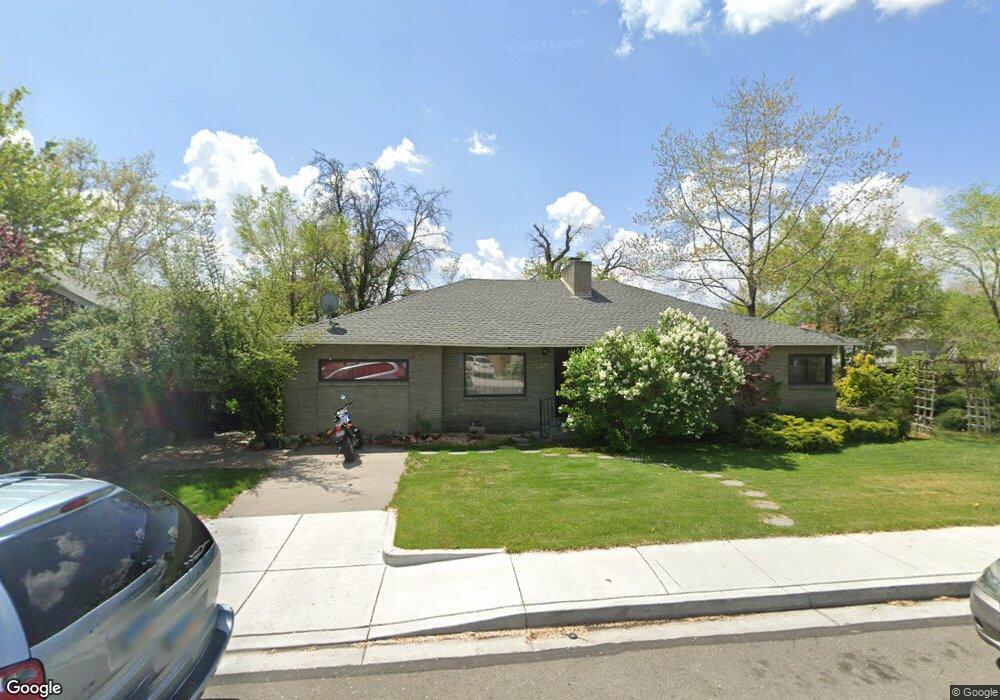
1631 F St Sparks, NV 89431
Downtown Sparks NeighborhoodEstimated Value: $373,000 - $481,000
3
Beds
1
Bath
1,615
Sq Ft
$253/Sq Ft
Est. Value
About This Home
This home is located at 1631 F St, Sparks, NV 89431 and is currently estimated at $408,965, approximately $253 per square foot. 1631 F St is a home located in Washoe County with nearby schools including Robert Mitchell Elementary School, Sparks Middle School, and Sparks High School.
Ownership History
Date
Name
Owned For
Owner Type
Purchase Details
Closed on
Dec 19, 2006
Sold by
Young Byron D and Young Joyce C
Bought by
Young Byron D and Young Joyce C
Current Estimated Value
Create a Home Valuation Report for This Property
The Home Valuation Report is an in-depth analysis detailing your home's value as well as a comparison with similar homes in the area
Home Values in the Area
Average Home Value in this Area
Purchase History
| Date | Buyer | Sale Price | Title Company |
|---|---|---|---|
| Young Byron D | -- | None Available | |
| Young Byron D | -- | None Available |
Source: Public Records
Tax History Compared to Growth
Tax History
| Year | Tax Paid | Tax Assessment Tax Assessment Total Assessment is a certain percentage of the fair market value that is determined by local assessors to be the total taxable value of land and additions on the property. | Land | Improvement |
|---|---|---|---|---|
| 2025 | $789 | $55,424 | $31,675 | $23,749 |
| 2024 | $789 | $49,843 | $26,467 | $23,376 |
| 2023 | $770 | $50,774 | $29,094 | $21,681 |
| 2022 | $746 | $39,211 | $21,546 | $17,665 |
| 2021 | $728 | $32,545 | $15,461 | $17,084 |
| 2020 | $712 | $31,922 | $15,029 | $16,893 |
| 2019 | $704 | $28,953 | $12,934 | $16,019 |
| 2018 | $675 | $25,049 | $9,709 | $15,340 |
| 2017 | $653 | $24,193 | $9,077 | $15,116 |
| 2016 | $640 | $22,219 | $7,049 | $15,170 |
| 2015 | $638 | $20,371 | $5,486 | $14,885 |
| 2014 | $621 | $17,658 | $3,624 | $14,034 |
| 2013 | -- | $16,144 | $2,594 | $13,550 |
Source: Public Records
Map
Nearby Homes