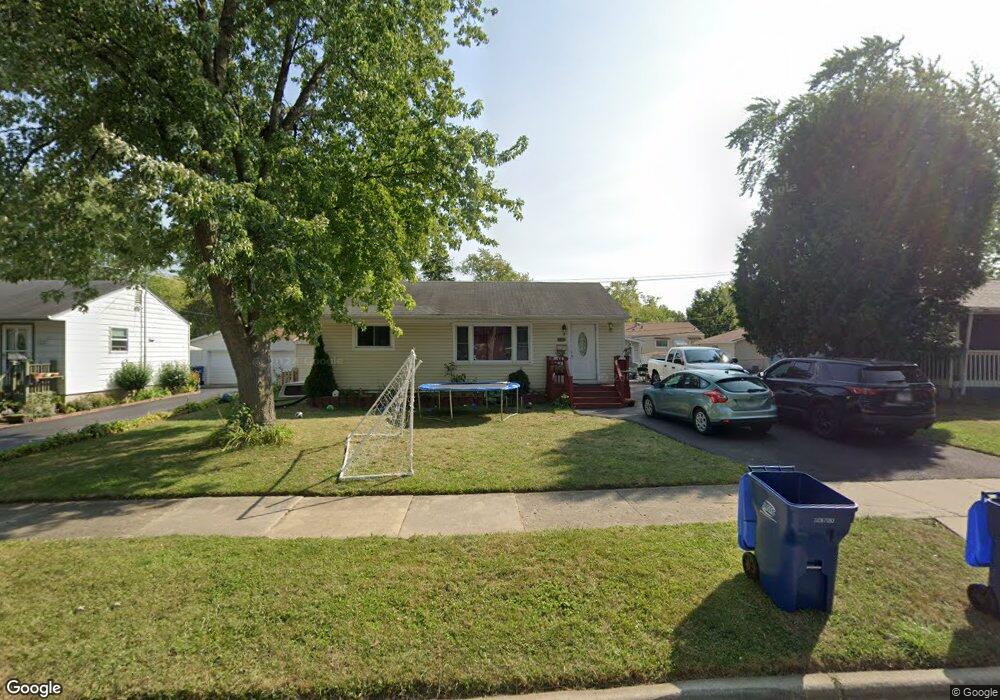
1631 Ferry St Waukegan, IL 60087
Lake County Gardens NeighborhoodEstimated Value: $199,000 - $211,805
3
Beds
2
Baths
864
Sq Ft
$238/Sq Ft
Est. Value
About This Home
This home is located at 1631 Ferry St, Waukegan, IL 60087 and is currently estimated at $205,451, approximately $237 per square foot. 1631 Ferry St is a home located in Lake County with nearby schools including Little Fort Elementary School, Jack Benny Middle School, and Waukegan High School.
Ownership History
Date
Name
Owned For
Owner Type
Purchase Details
Closed on
Nov 3, 2021
Sold by
Sonido Guillermo and Sonido Mirian
Bought by
Oropeza Rene Sonido
Current Estimated Value
Home Financials for this Owner
Home Financials are based on the most recent Mortgage that was taken out on this home.
Original Mortgage
$94,400
Interest Rate
2.37%
Mortgage Type
New Conventional
Purchase Details
Closed on
Aug 28, 2009
Sold by
Wells Patricia Ann and Toporek Janice
Bought by
Sonido Guillermo and Sonido Mirian
Home Financials for this Owner
Home Financials are based on the most recent Mortgage that was taken out on this home.
Original Mortgage
$104,080
Interest Rate
5.27%
Mortgage Type
FHA
Purchase Details
Closed on
Jul 31, 1978
Sold by
Muss Joshua A
Bought by
Harris Norman B and Harris Carol F
Create a Home Valuation Report for This Property
The Home Valuation Report is an in-depth analysis detailing your home's value as well as a comparison with similar homes in the area
Home Values in the Area
Average Home Value in this Area
Purchase History
| Date | Buyer | Sale Price | Title Company |
|---|---|---|---|
| Oropeza Rene Sonido | $118,000 | Fidelity National Title | |
| Sonido Guillermo | $106,000 | Greater Illinois Title Co | |
| Harris Norman B | -- | -- |
Source: Public Records
Mortgage History
| Date | Status | Borrower | Loan Amount |
|---|---|---|---|
| Previous Owner | Oropeza Rene Sonido | $94,400 | |
| Previous Owner | Sonido Guillermo | $104,080 |
Source: Public Records
Tax History Compared to Growth
Tax History
| Year | Tax Paid | Tax Assessment Tax Assessment Total Assessment is a certain percentage of the fair market value that is determined by local assessors to be the total taxable value of land and additions on the property. | Land | Improvement |
|---|---|---|---|---|
| 2024 | $5,034 | $67,953 | $8,287 | $59,666 |
| 2023 | $3,961 | $61,388 | $7,486 | $53,902 |
| 2022 | $3,961 | $46,514 | $7,132 | $39,382 |
| 2021 | $3,614 | $40,660 | $6,175 | $34,485 |
| 2020 | $3,614 | $37,880 | $5,753 | $32,127 |
| 2019 | $3,584 | $34,711 | $5,272 | $29,439 |
| 2018 | $2,761 | $27,732 | $6,716 | $21,016 |
| 2017 | $2,637 | $24,535 | $5,942 | $18,593 |
| 2016 | $2,367 | $21,320 | $5,163 | $16,157 |
| 2015 | $2,210 | $19,082 | $4,621 | $14,461 |
| 2014 | $2,098 | $17,942 | $5,071 | $12,871 |
| 2012 | $3,435 | $22,613 | $5,494 | $17,119 |
Source: Public Records
Map
Nearby Homes
- 1612 Whitney St
- 1636 Rice St
- 2613 N Lewis Ave
- 2350 N Lewis Ave
- 3211 Rugby Ct
- 37966 N Cornell Rd
- 2232 Walnut St
- 37905 N Loyola Ave
- 3411 N Lewis Ave
- 3101 Country Club Ln
- 2708 Dana Ave
- 2705 Dana Ave
- 301 W Eagle Ct
- 38127 N Shore Ave
- 38362 N Manor Ave
- 12312 W Audrey Ave
- 2713 Varonen Ave
- 0 Traditions Dr
- 1905 Linden Ave
- 10241 W Bairstow Ave
- 1627 Ferry St
- 1630 Partridge St
- 1624 Partridge St
- 1634 Partridge St Unit 4
- 1623 Ferry St
- 1639 Ferry St
- 1638 Partridge St
- 1620 Partridge St
- 1636 Ferry St
- 1632 Ferry St
- 1640 Ferry St
- 1619 Ferry St
- 1643 Ferry St
- 1628 Ferry St
- 1640 Partridge St
- 1644 Ferry St
- 1616 Partridge St
- 1624 Ferry St
- 1613 Ferry St
- 1647 Ferry St