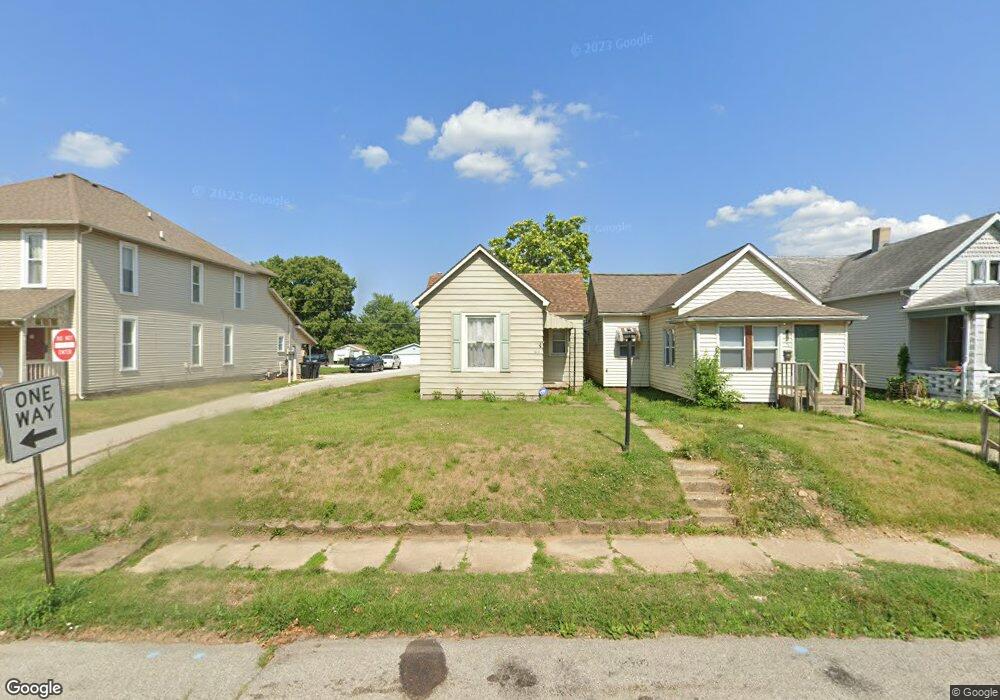
1631 N 13th St Lafayette, IN 47904
Monon NeighborhoodEstimated Value: $116,000 - $164,000
--
Bed
--
Bath
1,104
Sq Ft
$122/Sq Ft
Est. Value
About This Home
This home is located at 1631 N 13th St, Lafayette, IN 47904 and is currently estimated at $134,545, approximately $121 per square foot. 1631 N 13th St is a home located in Tippecanoe County with nearby schools including Vinton Elementary School, Sunnyside Intermediate School, and Lafayette Tecumseh Junior High School.
Ownership History
Date
Name
Owned For
Owner Type
Purchase Details
Closed on
Mar 24, 2023
Sold by
Lewis Milton R and Lewis Kellye E
Bought by
Cholula Carlos and Cordero Andrea
Current Estimated Value
Home Financials for this Owner
Home Financials are based on the most recent Mortgage that was taken out on this home.
Original Mortgage
$10,000
Interest Rate
6.32%
Mortgage Type
Seller Take Back
Purchase Details
Closed on
Jul 11, 2003
Sold by
Rider James M and Rider Dorothy A
Bought by
Kl Dickson Llc
Purchase Details
Closed on
Mar 8, 2001
Sold by
Dickson M Leon and Dickson Kathryn T
Bought by
Kl Dickson Llc
Home Financials for this Owner
Home Financials are based on the most recent Mortgage that was taken out on this home.
Original Mortgage
$58,000
Interest Rate
8%
Mortgage Type
Purchase Money Mortgage
Create a Home Valuation Report for This Property
The Home Valuation Report is an in-depth analysis detailing your home's value as well as a comparison with similar homes in the area
Home Values in the Area
Average Home Value in this Area
Purchase History
| Date | Buyer | Sale Price | Title Company |
|---|---|---|---|
| Cholula Carlos | $95,000 | -- | |
| Lewis Milton R | $95,000 | Metropolitan Title | |
| Kl Dickson Llc | -- | -- | |
| Kl Dickson Llc | -- | -- |
Source: Public Records
Mortgage History
| Date | Status | Borrower | Loan Amount |
|---|---|---|---|
| Closed | Cholula Carlos | $10,000 | |
| Previous Owner | Kl Dickson Llc | $58,000 |
Source: Public Records
Tax History Compared to Growth
Tax History
| Year | Tax Paid | Tax Assessment Tax Assessment Total Assessment is a certain percentage of the fair market value that is determined by local assessors to be the total taxable value of land and additions on the property. | Land | Improvement |
|---|---|---|---|---|
| 2024 | $2,766 | $104,800 | $9,800 | $95,000 |
| 2023 | $1,218 | $60,900 | $9,800 | $51,100 |
| 2022 | $1,108 | $55,400 | $9,800 | $45,600 |
| 2021 | $1,008 | $50,400 | $9,800 | $40,600 |
| 2020 | $840 | $42,000 | $9,800 | $32,200 |
| 2019 | $824 | $41,200 | $11,000 | $30,200 |
| 2018 | $824 | $41,200 | $11,000 | $30,200 |
| 2017 | $820 | $41,000 | $11,000 | $30,000 |
| 2016 | $812 | $40,600 | $11,000 | $29,600 |
| 2014 | $818 | $40,900 | $11,000 | $29,900 |
| 2013 | $828 | $41,400 | $11,000 | $30,400 |
Source: Public Records
Map
Nearby Homes
- 1411 N 14th St
- 1831 N 13th St
- 1430 N 16th St
- 108 Barbee St
- 1904 Greenbush St
- 1803 Pierce St
- 2100 N 18th St
- 1000 Hartford St
- 1925 Maple St
- 1931 Morton St
- 2215 N 18th St
- 802 Tippecanoe St
- 2131 Vinton St
- 2127 Perrine St
- 2022 Elk St
- 2340 N 20th St
- 620 N 11th St Unit 22
- 2001 Schuyler Ave
- 2226 N 23rd St
- 1201 Cincinnati St
- 1629 N 13th St
- 1627 N 13th St
- 1701 N 13th St Unit 17
- 1705 N 13th St Unit 17
- 1623 N 13th St
- 1711 N 13th St
- 1621 N 13th St
- 1626 N 13th St
- 1617 N 13th St
- 1630 N 13th St
- 1715 N 13th St
- 1700 N 13th St
- 1624 N 13th St
- 1706 N 13th St
- 1710 N 13th St
- 1611 N 13th St
- 1620 N 13th St
- 1721 N 13th St
- 1718 N 15th St
- 1718 N 13th St