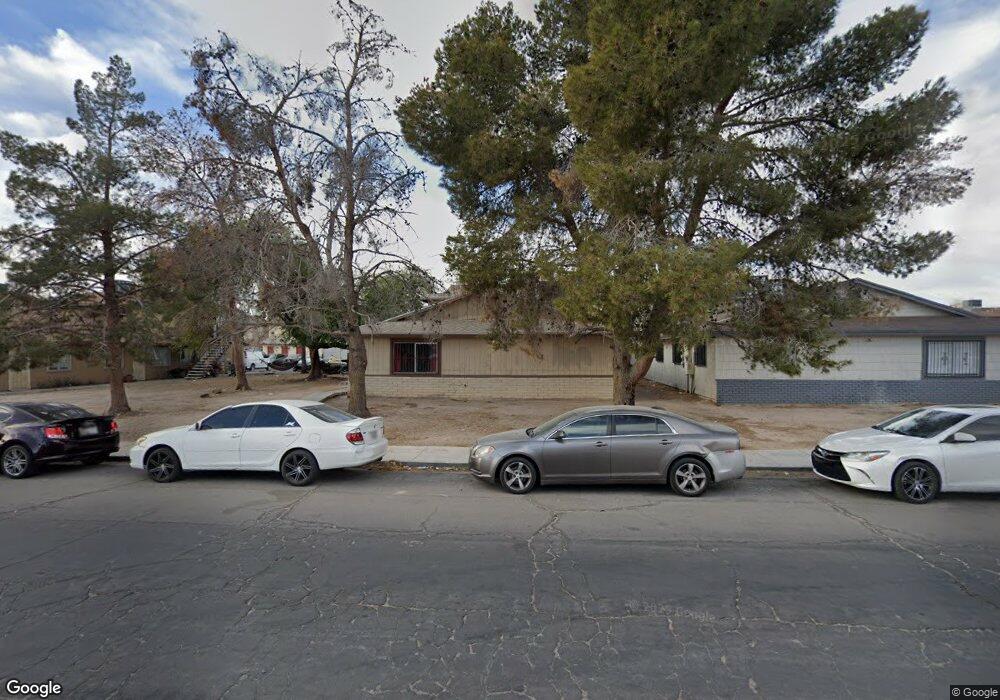
1631 N Lamont St Las Vegas, NV 89115
Estimated Value: $613,214 - $721,000
8
Beds
4
Baths
3,080
Sq Ft
$215/Sq Ft
Est. Value
About This Home
This home is located at 1631 N Lamont St, Las Vegas, NV 89115 and is currently estimated at $661,804, approximately $214 per square foot. 1631 N Lamont St is a home located in Clark County with nearby schools including Ann Lynch Elementary School, Mario C. & Joanne Monaco Middle School, and Sunrise Mountain High School.
Ownership History
Date
Name
Owned For
Owner Type
Purchase Details
Closed on
Jan 2, 2022
Sold by
Pb Rental Services Llc
Bought by
Mjpb Trust and Bonilla
Current Estimated Value
Home Financials for this Owner
Home Financials are based on the most recent Mortgage that was taken out on this home.
Original Mortgage
$126,000
Outstanding Balance
$99,232
Interest Rate
2.39%
Mortgage Type
New Conventional
Estimated Equity
$562,572
Purchase Details
Closed on
May 6, 2021
Sold by
Porras Mario and Bonilla Leticia
Bought by
Pb Rentals Services Llc Series 2
Purchase Details
Closed on
Aug 24, 2001
Sold by
Beavers James O
Bought by
Bonilla Leticia
Home Financials for this Owner
Home Financials are based on the most recent Mortgage that was taken out on this home.
Original Mortgage
$202,144
Interest Rate
7.09%
Mortgage Type
FHA
Create a Home Valuation Report for This Property
The Home Valuation Report is an in-depth analysis detailing your home's value as well as a comparison with similar homes in the area
Home Values in the Area
Average Home Value in this Area
Purchase History
| Date | Buyer | Sale Price | Title Company |
|---|---|---|---|
| Mjpb Trust | -- | Wfg National Title | |
| Pb Rentals Services Llc Series 2 | -- | None Available | |
| Mjpb Trust | -- | None Listed On Document | |
| Bonilla Leticia | $205,000 | First American Title Co |
Source: Public Records
Mortgage History
| Date | Status | Borrower | Loan Amount |
|---|---|---|---|
| Open | Mjpb Trust | $126,000 | |
| Previous Owner | Bonilla Leticia | $202,144 |
Source: Public Records
Tax History Compared to Growth
Tax History
| Year | Tax Paid | Tax Assessment Tax Assessment Total Assessment is a certain percentage of the fair market value that is determined by local assessors to be the total taxable value of land and additions on the property. | Land | Improvement |
|---|---|---|---|---|
| 2025 | $1,195 | $93,275 | $48,650 | $44,625 |
| 2024 | $1,160 | $93,275 | $48,650 | $44,625 |
| 2023 | $1,217 | $86,420 | $44,100 | $42,320 |
| 2022 | $1,235 | $77,491 | $36,750 | $40,741 |
| 2021 | $1,144 | $68,971 | $29,750 | $39,221 |
| 2020 | $1,059 | $68,243 | $28,350 | $39,893 |
| 2019 | $993 | $64,164 | $24,150 | $40,014 |
| 2018 | $947 | $55,826 | $16,800 | $39,026 |
| 2017 | $1,447 | $49,330 | $9,800 | $39,530 |
| 2016 | $888 | $48,161 | $7,000 | $41,161 |
| 2015 | $887 | $39,291 | $7,000 | $32,291 |
| 2014 | $859 | $47,767 | $7,000 | $40,767 |
Source: Public Records
Map
Nearby Homes
- 1654 Nesting Way
- 4928 E Monroe Ave
- 4637 Baby Bird Ln
- 4612 Supreme Ct
- 4609 Little Finch Ln
- 4568 Little Finch Ln
- 1919 Verde Mirada Dr
- 1112 Sandy Cove St
- 1611 Lovebird Ln Unit 4
- 1385 Ringe Ln
- 4639 Poetic Author Ave
- 4809 Sunny Brook Ave
- 4932 E Washington Ave
- 1952 Metamora St
- 4549 Morton Grove Ave
- 1009 Greenbank St
- 26 Arcade Cir
- 4828 Lakestream Ave
- 4487 E Lake Mead Blvd Unit 55
- 4487 E Lake Mead Blvd Unit 57
- 1641 N Lamont St Unit D
- 1641 N Lamont St
- 1641 N Lamont St Unit A
- 1641 N Lamont St
- 1621 N Lamont St Unit 14
- 1621 N Lamont St
- 1630 Mary Jane Dr
- 1651 N Lamont St
- 1640 Mary Jane Dr
- 1620 Mary Jane Dr
- 1611 N Lamont St
- 1620 N Lamont St
- 1650 Mary Jane Dr
- 1610 Mary Jane Dr
- 1661 N Lamont St
- 1630 N Lamont St
- 1662 N Lamont St
- 1660 Mary Jane Dr
- 4908 Chidlaw Ave Unit 1
- 4908 Chidlaw Ave Unit 3