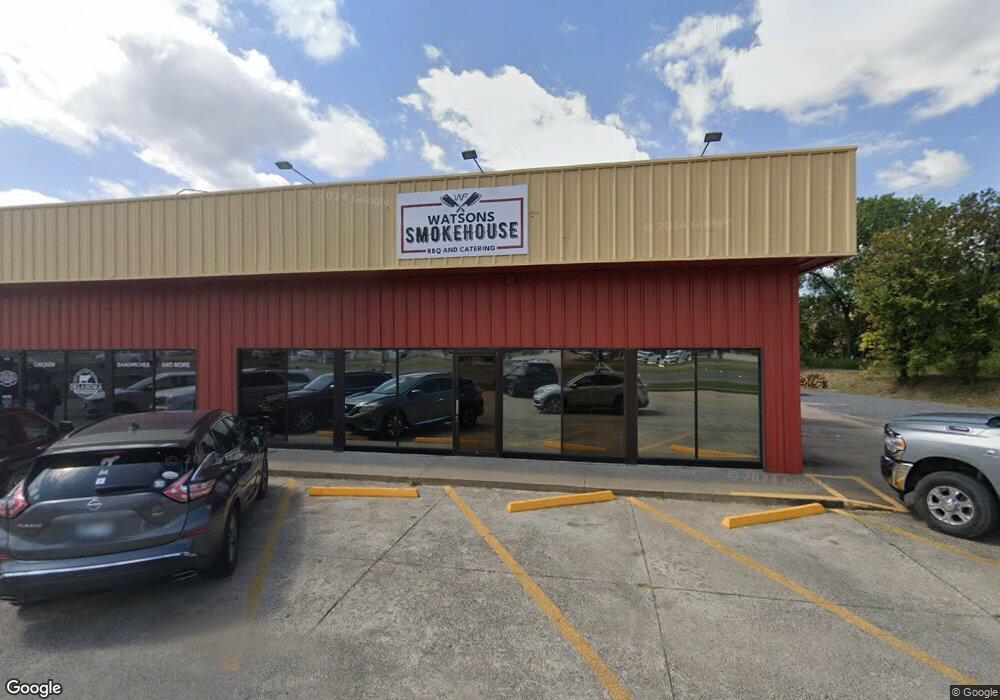
1631 N Main St Muskogee, OK 74401
Central Muskogee NeighborhoodEstimated Value: $333,386
--
Bed
2
Baths
8,000
Sq Ft
$42/Sq Ft
Est. Value
About This Home
This home is located at 1631 N Main St, Muskogee, OK 74401 and is currently priced at $333,386, approximately $41 per square foot. 1631 N Main St is a home located in Muskogee County with nearby schools including 8th & 9th Grade Academy @ Alice Robertson, Muskogee High School, and Boulevard Christian School.
Ownership History
Date
Name
Owned For
Owner Type
Purchase Details
Closed on
Oct 3, 2025
Sold by
Watson Farms Meat Processing & Market Ll
Bought by
Watson Farms Properties Llc
Current Estimated Value
Purchase Details
Closed on
Mar 31, 2010
Sold by
Three R Properties
Bought by
Mpi Investments Llc
Home Financials for this Owner
Home Financials are based on the most recent Mortgage that was taken out on this home.
Original Mortgage
$272,000
Interest Rate
5%
Mortgage Type
Commercial
Purchase Details
Closed on
Oct 1, 1992
Purchase Details
Closed on
Apr 1, 1992
Create a Home Valuation Report for This Property
The Home Valuation Report is an in-depth analysis detailing your home's value as well as a comparison with similar homes in the area
Home Values in the Area
Average Home Value in this Area
Purchase History
| Date | Buyer | Sale Price | Title Company |
|---|---|---|---|
| Watson Farms Properties Llc | -- | None Listed On Document | |
| Mpi Investments Llc | $340,000 | Pioneer Abstract & Title Co | |
| -- | $200,000 | -- | |
| -- | $50,000 | -- |
Source: Public Records
Mortgage History
| Date | Status | Borrower | Loan Amount |
|---|---|---|---|
| Previous Owner | Mpi Investments Llc | $272,000 |
Source: Public Records
Tax History Compared to Growth
Tax History
| Year | Tax Paid | Tax Assessment Tax Assessment Total Assessment is a certain percentage of the fair market value that is determined by local assessors to be the total taxable value of land and additions on the property. | Land | Improvement |
|---|---|---|---|---|
| 2025 | $3,826 | $36,873 | $7,283 | $29,590 |
| 2024 | $3,826 | $35,117 | $7,283 | $27,834 |
| 2023 | $3,826 | $34,650 | $3,367 | $31,283 |
| 2022 | $3,734 | $37,470 | $3,642 | $33,828 |
| 2021 | $3,751 | $37,470 | $3,642 | $33,828 |
| 2020 | $3,757 | $37,470 | $3,642 | $33,828 |
| 2019 | $3,728 | $37,471 | $3,642 | $33,829 |
| 2018 | $3,651 | $37,471 | $3,642 | $33,829 |
| 2017 | $3,569 | $37,470 | $3,642 | $33,828 |
| 2016 | $3,569 | $37,470 | $3,642 | $33,828 |
| 2015 | $3,599 | $37,470 | $3,642 | $33,828 |
| 2014 | $1 | $37,470 | $3,642 | $33,828 |
Source: Public Records
Map
Nearby Homes