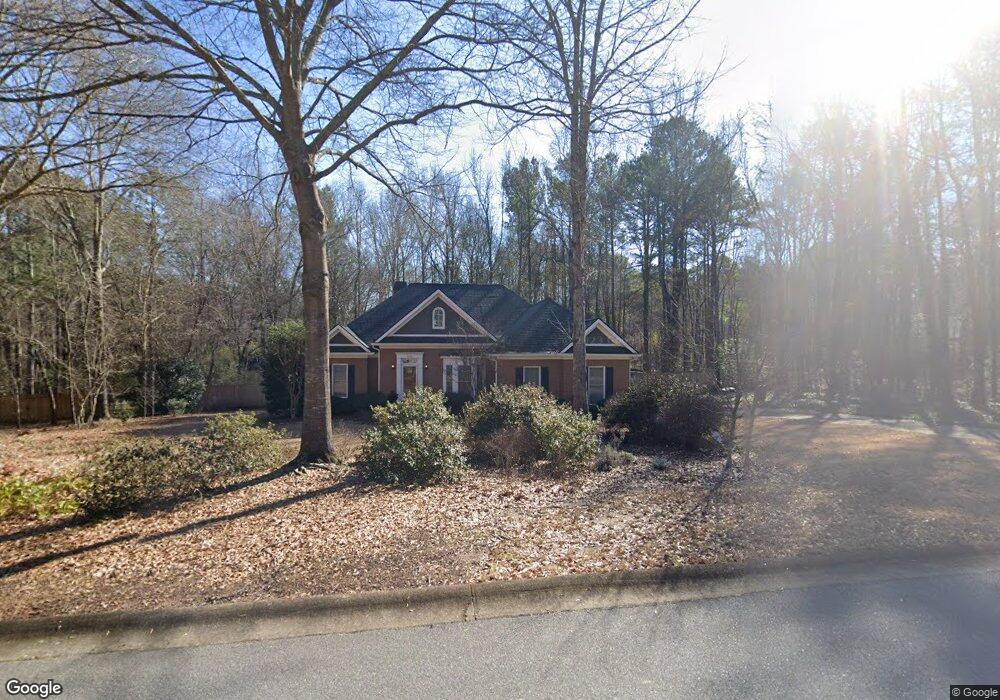
1631 Oconee Crossing Cir Watkinsville, GA 30677
Estimated Value: $478,000 - $615,000
3
Beds
3
Baths
2,066
Sq Ft
$250/Sq Ft
Est. Value
About This Home
This home is located at 1631 Oconee Crossing Cir, Watkinsville, GA 30677 and is currently estimated at $516,804, approximately $250 per square foot. 1631 Oconee Crossing Cir is a home located in Oconee County with nearby schools including Rocky Branch Elementary School, Malcom Bridge Middle School, and North Oconee High School.
Ownership History
Date
Name
Owned For
Owner Type
Purchase Details
Closed on
Oct 9, 2015
Sold by
Riner Susan Blanton Execut
Bought by
Box Stacey Heath and Box Heather Marie
Current Estimated Value
Home Financials for this Owner
Home Financials are based on the most recent Mortgage that was taken out on this home.
Original Mortgage
$176,800
Outstanding Balance
$129,432
Interest Rate
3.94%
Mortgage Type
New Conventional
Estimated Equity
$387,372
Purchase Details
Closed on
Apr 8, 2013
Sold by
Blanton Richard Coleman
Bought by
Blanton Richard Coleman and Blanton Catherine Berry
Purchase Details
Closed on
Apr 30, 2008
Sold by
Not Provided
Bought by
Blanton Richard Coleman
Purchase Details
Closed on
Apr 14, 2003
Sold by
King William M
Bought by
Coolins Gary J
Purchase Details
Closed on
Mar 17, 2000
Sold by
Saunders Thomas S
Bought by
King William M
Purchase Details
Closed on
Aug 29, 1997
Sold by
First South Homes I
Bought by
Saunders Thomas S
Create a Home Valuation Report for This Property
The Home Valuation Report is an in-depth analysis detailing your home's value as well as a comparison with similar homes in the area
Home Values in the Area
Average Home Value in this Area
Purchase History
| Date | Buyer | Sale Price | Title Company |
|---|---|---|---|
| Box Stacey Heath | $221,000 | -- | |
| Blanton Richard Coleman | -- | -- | |
| Blanton Richard Coleman | -- | -- | |
| Blanton Richard Coleman | $225,000 | -- | |
| Coolins Gary J | $210,000 | -- | |
| King William M | $162,500 | -- | |
| Saunders Thomas S | $155,000 | -- |
Source: Public Records
Mortgage History
| Date | Status | Borrower | Loan Amount |
|---|---|---|---|
| Open | Box Stacey Heath | $176,800 |
Source: Public Records
Tax History Compared to Growth
Tax History
| Year | Tax Paid | Tax Assessment Tax Assessment Total Assessment is a certain percentage of the fair market value that is determined by local assessors to be the total taxable value of land and additions on the property. | Land | Improvement |
|---|---|---|---|---|
| 2024 | $3,569 | $179,629 | $30,000 | $149,629 |
| 2023 | $3,599 | $167,517 | $26,000 | $141,517 |
| 2022 | $3,191 | $148,521 | $26,000 | $122,521 |
| 2021 | $2,490 | $107,486 | $20,000 | $87,486 |
| 2020 | $2,350 | $101,261 | $20,000 | $81,261 |
| 2019 | $2,335 | $100,617 | $20,000 | $80,617 |
| 2018 | $2,262 | $95,470 | $20,000 | $75,470 |
| 2017 | $2,103 | $88,765 | $20,000 | $68,765 |
| 2016 | $2,061 | $85,001 | $20,000 | $65,001 |
| 2015 | $1,942 | $81,961 | $20,000 | $61,961 |
| 2014 | $1,901 | $78,614 | $24,000 | $54,614 |
| 2013 | -- | $76,536 | $24,000 | $52,536 |
Source: Public Records
Map
Nearby Homes
- N/A Hog Mountain Rd
- 1901 Hog Mountain Rd
- 1921 Hog Mountain Rd
- 4611 Monroe Hwy - Hwy 78
- 4611 Monroe Hwy - Hwy 78 Unit PARCEL C
- 6441 Hog Mountain Rd
- 1462 Brookstone Crossing
- 1111 Brookstone Crossing Unit 11D
- 1111 Brookside Terrace
- 1111 Brookside Terrace Unit 2011D
- 1111 Brookside Terrace
- 2903 Brookstone Crossing Unit 34-B
- 2903 Brookstone Crossing
- 1621 Westland Ct
- 1621 Westland Ct Unit 2014 B
- 1547 Westland Ct Unit 2015 B
- 1547 Westland Ct
- 1383 Westland Ct
- 1383 Westland Ct Unit 17D
- 1383 Westland Ct
- 1631 Oconee Crossing Cir
- 0 Oconee Crossing Cir Unit 7242140
- 0 Oconee Crossing Cir Unit 3254074
- 0 Oconee Crossing Cir Unit 3217481
- 0 Oconee Crossing Cir Unit 3231238
- 0 Oconee Crossing Cir Unit 3192631
- 0 Oconee Crossing Cir
- 1621 Oconee Crossing Cir
- 1661 Oconee Crossing Cir
- 1621 Oconee Crossing Cir
- 1691 Oconee Crossing Cir
- 1691 Oconee Crossing Cir
- 1711 Oconee Crossing Cir
- 1620 Oconee Crossing Cir
- 1601 Oconee Crossing Cir
- 1051 Oconee Crossing Cir
- 1041 Oconee Crossing Cir
- 1630 Oconee Crossing Cir
- 1670 Oconee Crossing Cir
- 1011 Oconee Crossing Cir